> ## Documentation Index
> Fetch the complete documentation index at: https://benchgen.com/docs/llms.txt
> Use this file to discover all available pages before exploring further.
# Evaluate an Inference Model
> Benchmark a live inference endpoint against an Eval environment, monitor the run in real time, and read the scored results.
Once a model is [running as an inference endpoint](/eval/run-an-inference-model), you can benchmark it against any environment in Eval. BenchGen runs the model over every test case in the environment, scores each response, and produces a results report with downloadable predictions and a breakdown for every item.
**Need a running model first?** This guide assumes you already have a live endpoint. If you don't, follow [Deploy an inference model](/eval/run-an-inference-model) and come back once its status reads **running**.
***
## Prerequisites
* A model in the **running** state. See [Deploy an inference model](/eval/run-an-inference-model).
* A benchmark or environment to evaluate against, either from the Environments Hub or a [custom environment](/eval/create-environment) you uploaded.
***
## Steps
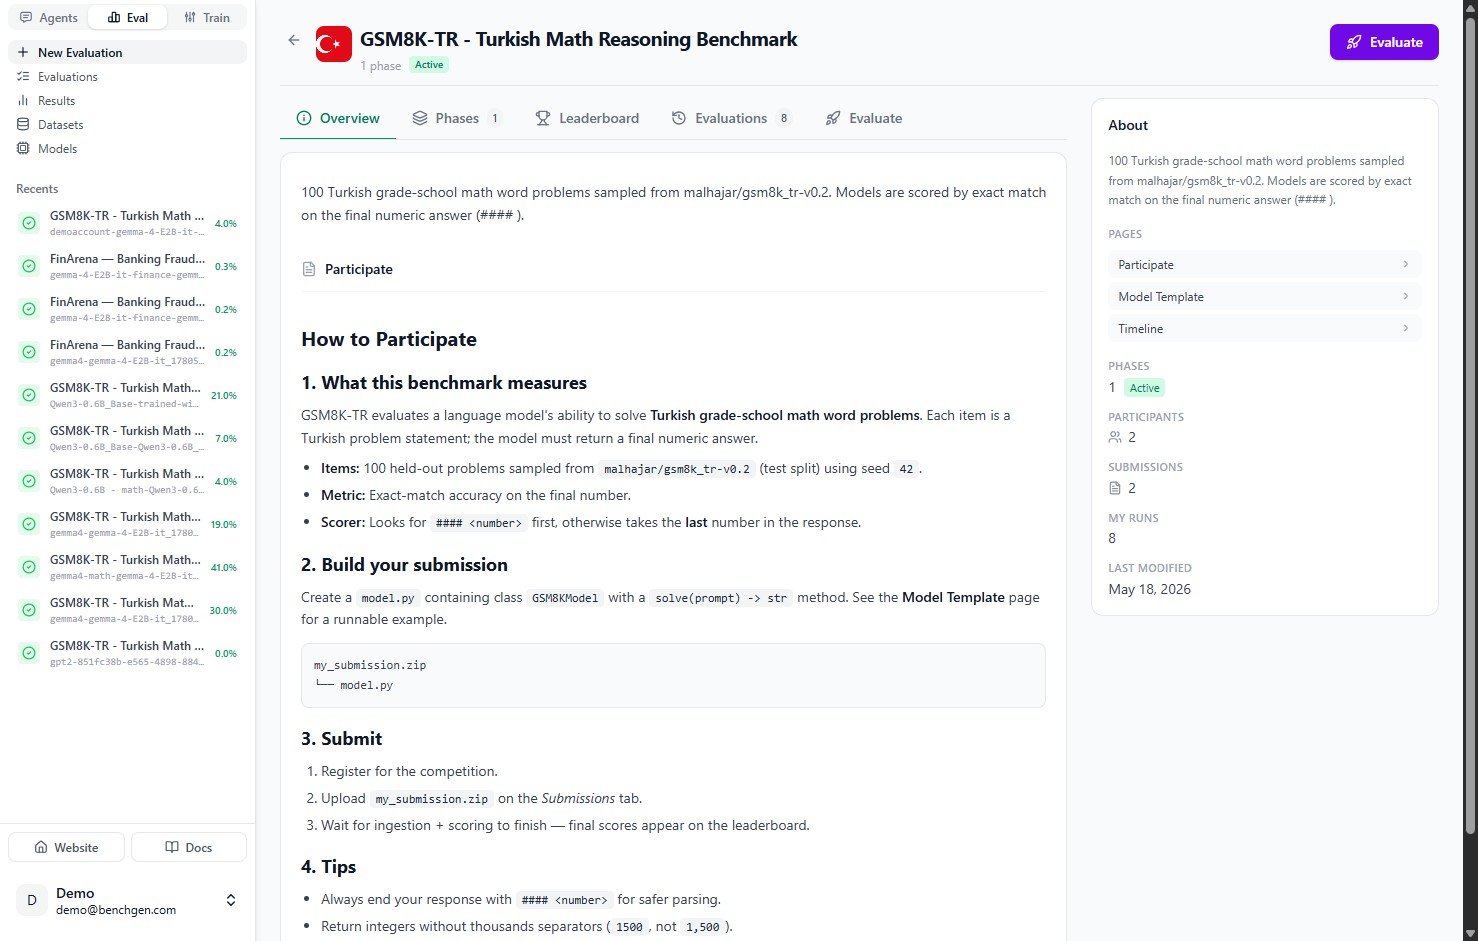
### 1. Open a benchmark
Open the environment you want to evaluate against. Its **Overview** tab describes what the benchmark measures and how submissions are scored, and shows tabs for **Phases**, **Leaderboard**, **Evaluations**, and **Evaluate**.
To start, click **Evaluate** in the top right corner, or open the **Evaluate** tab.
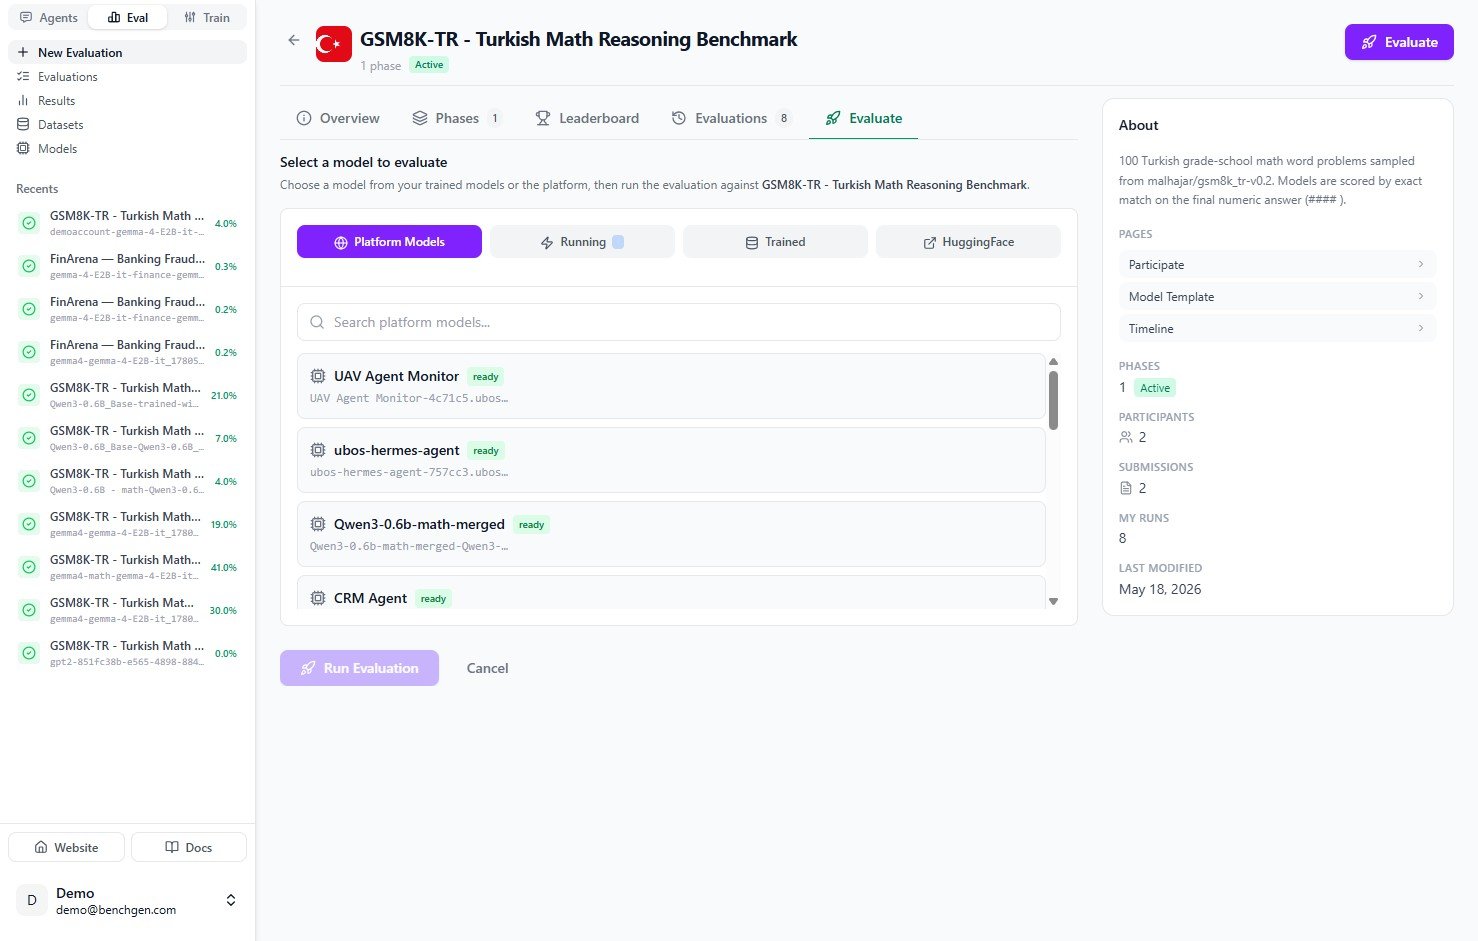
 ### 2. Choose a model source
The **Evaluate** tab opens with **"Select a model to evaluate."** Models are grouped by source. Pick the tab that matches where your model lives:
| Source | Use when |
| ------------------- | ---------------------------------------------------------------- |
| **Platform Models** | The model is already published or deployed on BenchGen. |
| **Running** | The model is a live endpoint you started with **Run Inference**. |
| **Trained** | The model is a checkpoint you fine-tuned in Train. |
| **HuggingFace** | You want to pull a public model from the HuggingFace Hub. |
### 2. Choose a model source
The **Evaluate** tab opens with **"Select a model to evaluate."** Models are grouped by source. Pick the tab that matches where your model lives:
| Source | Use when |
| ------------------- | ---------------------------------------------------------------- |
| **Platform Models** | The model is already published or deployed on BenchGen. |
| **Running** | The model is a live endpoint you started with **Run Inference**. |
| **Trained** | The model is a checkpoint you fine-tuned in Train. |
| **HuggingFace** | You want to pull a public model from the HuggingFace Hub. |
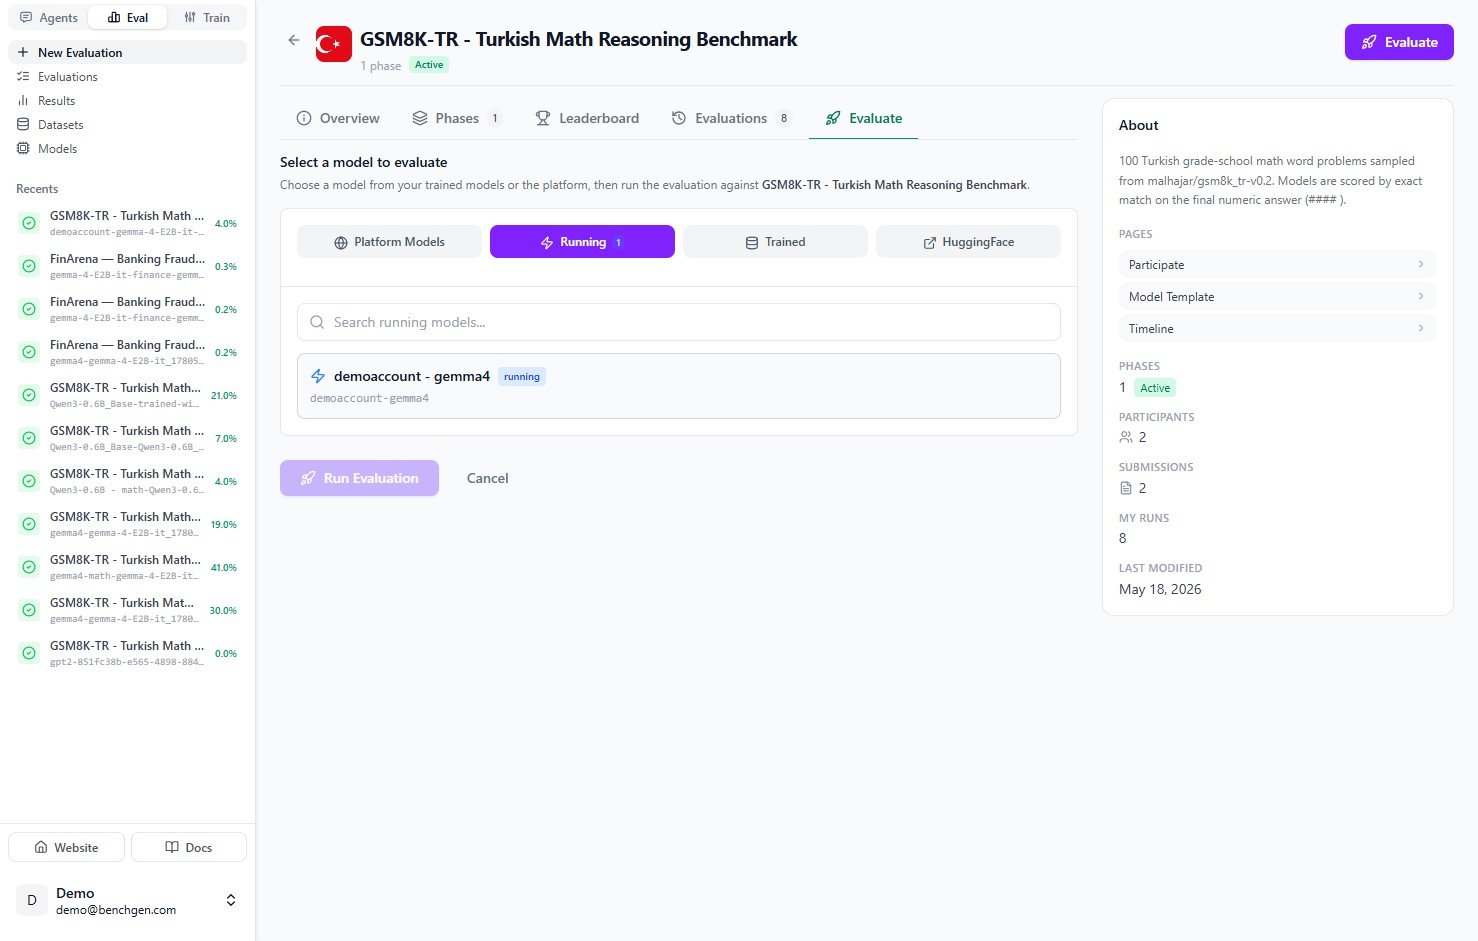
 ### 3. Select your running model
Since you just deployed an endpoint, click the **Running** tab. It lists every model that is currently live. Find the one you deployed. It shows a green **running** badge.
### 3. Select your running model
Since you just deployed an endpoint, click the **Running** tab. It lists every model that is currently live. Find the one you deployed. It shows a green **running** badge.
 Click the model to select it. A checkmark appears and the **Run Evaluation** button becomes active.
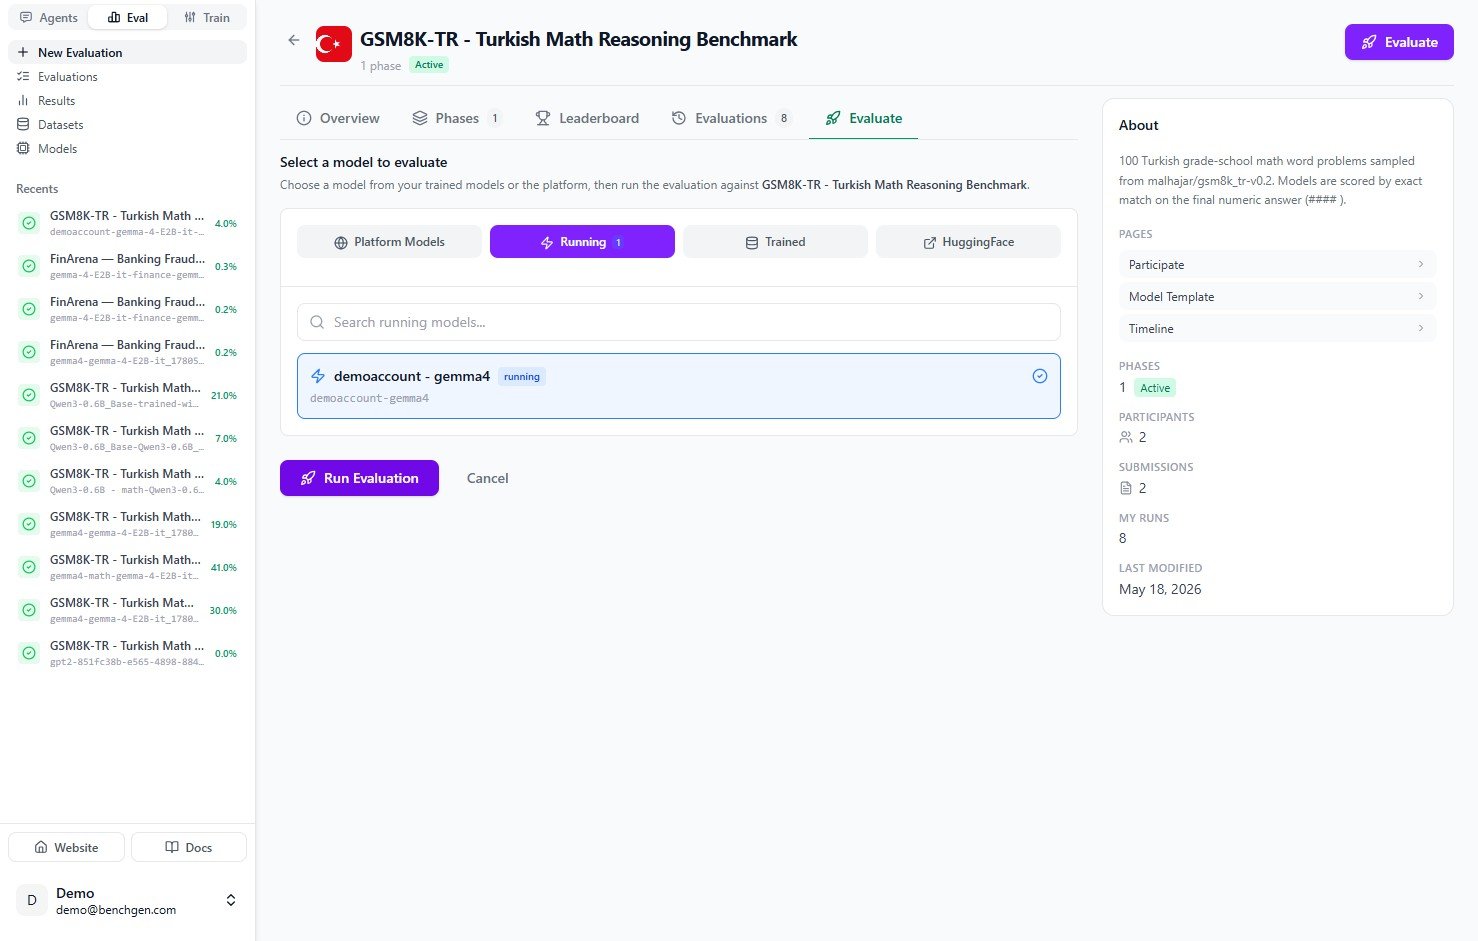 ### 4. Run the evaluation
Click **Run Evaluation**. BenchGen creates an evaluation run, generates a submission for the selected environment, and starts running your model against the test cases.
### 5. Monitor progress
The run opens to a **live log** view. Status messages stream as the run progresses: it loads the benchmark data, runs the model on each item, and reports progress like `Processing: 10/100 (10%)`.
### 4. Run the evaluation
Click **Run Evaluation**. BenchGen creates an evaluation run, generates a submission for the selected environment, and starts running your model against the test cases.
### 5. Monitor progress
The run opens to a **live log** view. Status messages stream as the run progresses: it loads the benchmark data, runs the model on each item, and reports progress like `Processing: 10/100 (10%)`.
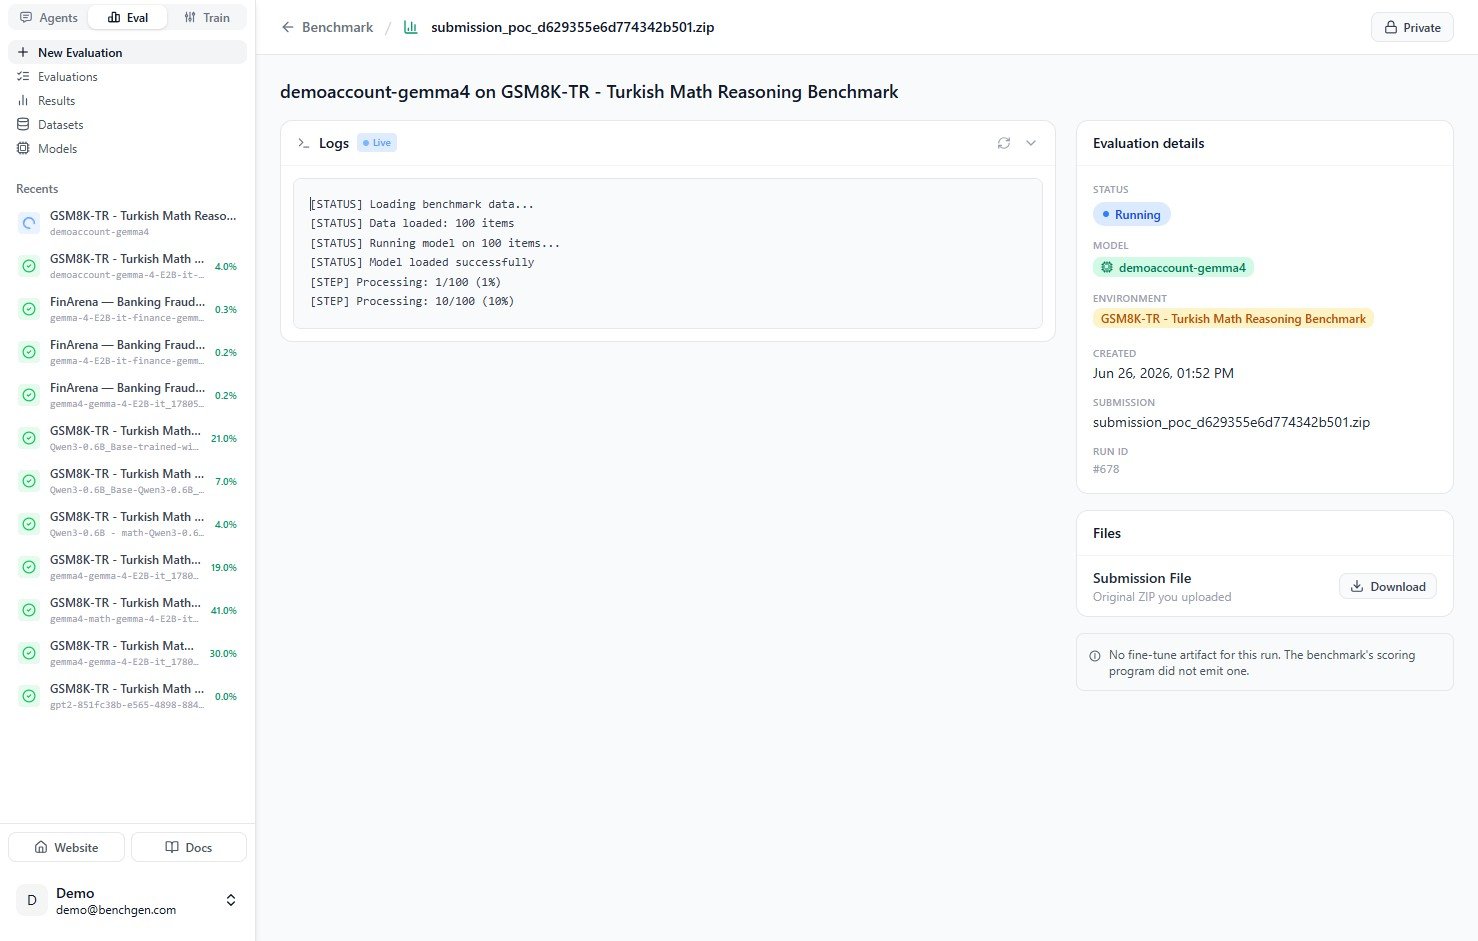 The **Evaluation details** panel on the right sums up the run:
| Field | Meaning |
| --------------- | ------------------------------------------------------- |
| **Status** | `Running` while in progress, `Completed` when finished. |
| **Model** | The model being evaluated. |
| **Environment** | The benchmark the model is scored against. |
| **Created** | When the run started. |
| **Submission** | The generated submission archive for this run. |
| **Run ID** | Unique identifier for the run, for example `#678`. |
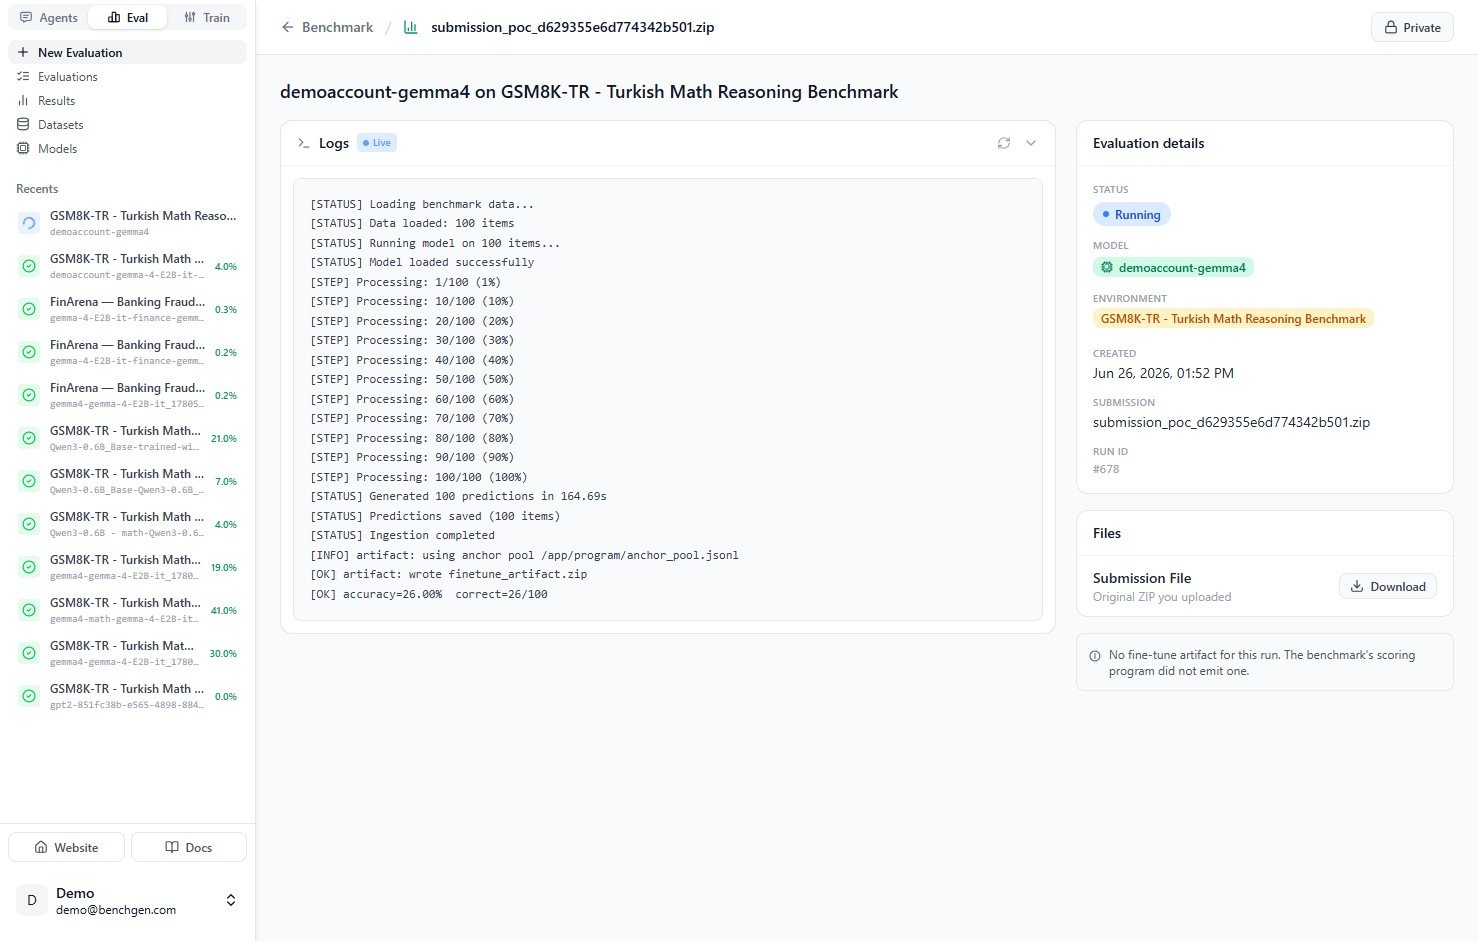
As the run nears completion, the logs show predictions being generated and the final score being computed, for example `accuracy=26.00% correct=26/100`.
The **Evaluation details** panel on the right sums up the run:
| Field | Meaning |
| --------------- | ------------------------------------------------------- |
| **Status** | `Running` while in progress, `Completed` when finished. |
| **Model** | The model being evaluated. |
| **Environment** | The benchmark the model is scored against. |
| **Created** | When the run started. |
| **Submission** | The generated submission archive for this run. |
| **Run ID** | Unique identifier for the run, for example `#678`. |
As the run nears completion, the logs show predictions being generated and the final score being computed, for example `accuracy=26.00% correct=26/100`.
 ### 6. Review scores and results
When the run finishes, the status turns to **Completed** and a **Score Breakdown** replaces the live logs.
### 6. Review scores and results
When the run finishes, the status turns to **Completed** and a **Score Breakdown** replaces the live logs.
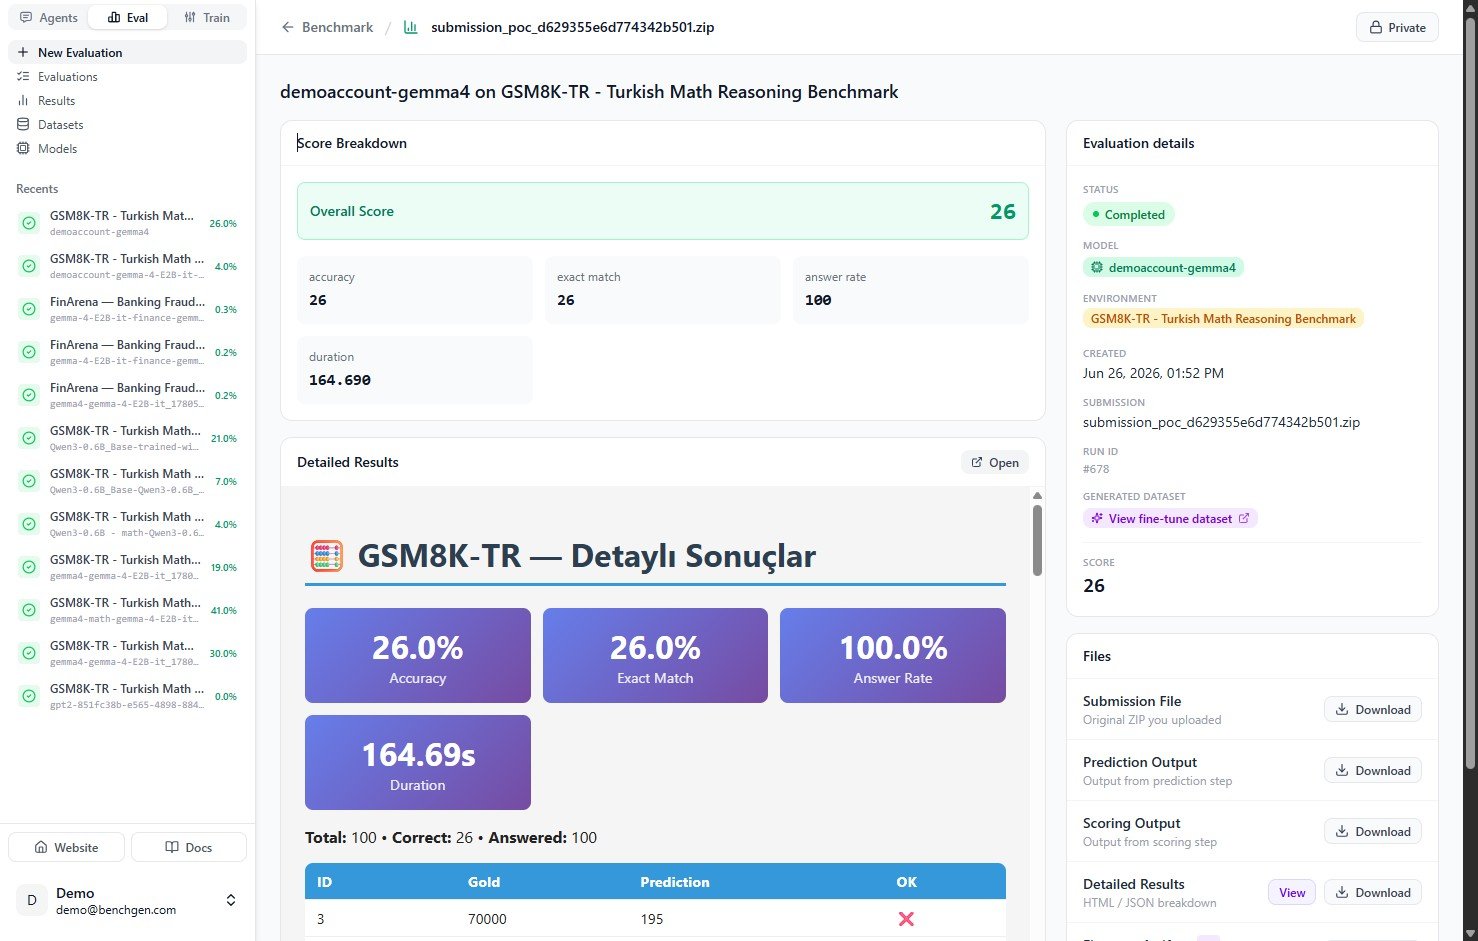 The headline **Overall Score** sits at the top, followed by the individual metrics:
| Metric | Meaning |
| ----------------- | ----------------------------------------------------------------- |
| **Overall Score** | The headline score for the run. |
| **accuracy** | Percentage of items answered correctly. |
| **exact match** | Percentage of responses that matched the expected answer exactly. |
| **answer rate** | Percentage of items the model produced any answer for. |
| **duration** | Wall-clock time for the full run. |
Below the metrics, **Detailed Results** shows a table with one row per test case. Each row lists the item ID, the gold (expected) answer, the model's prediction, and whether it was correct.
#### Download the artifacts
The **Files** section in the panel on the right lets you download everything the run produced:
| File | Contents |
| --------------------- | ---------------------------------------------------------------------------------------------------------------------- |
| **Submission File** | The original archive submitted to the benchmark. |
| **Prediction Output** | The model's raw predictions for every item. |
| **Scoring Output** | The output emitted by the environment's scoring program. |
| **Detailed Results** | The full breakdown for every item. View it in the browser or download it as HTML or JSON. |
| **Generated dataset** | When the environment emits one, a fine-tune dataset you can open with **View fine-tune dataset** and carry into Train. |
Failing cases captured in the generated dataset are exactly what you feed into a fine-tune. See [Export datasets to Train](/eval/export-datasets) to turn this run's misses into your next training set.
***
## Next Steps
* [Read results](/eval/read-results)
* [Export datasets to Train](/eval/export-datasets)
* [Deploy an inference model](/eval/run-an-inference-model)
The headline **Overall Score** sits at the top, followed by the individual metrics:
| Metric | Meaning |
| ----------------- | ----------------------------------------------------------------- |
| **Overall Score** | The headline score for the run. |
| **accuracy** | Percentage of items answered correctly. |
| **exact match** | Percentage of responses that matched the expected answer exactly. |
| **answer rate** | Percentage of items the model produced any answer for. |
| **duration** | Wall-clock time for the full run. |
Below the metrics, **Detailed Results** shows a table with one row per test case. Each row lists the item ID, the gold (expected) answer, the model's prediction, and whether it was correct.
#### Download the artifacts
The **Files** section in the panel on the right lets you download everything the run produced:
| File | Contents |
| --------------------- | ---------------------------------------------------------------------------------------------------------------------- |
| **Submission File** | The original archive submitted to the benchmark. |
| **Prediction Output** | The model's raw predictions for every item. |
| **Scoring Output** | The output emitted by the environment's scoring program. |
| **Detailed Results** | The full breakdown for every item. View it in the browser or download it as HTML or JSON. |
| **Generated dataset** | When the environment emits one, a fine-tune dataset you can open with **View fine-tune dataset** and carry into Train. |
Failing cases captured in the generated dataset are exactly what you feed into a fine-tune. See [Export datasets to Train](/eval/export-datasets) to turn this run's misses into your next training set.
***
## Next Steps
* [Read results](/eval/read-results)
* [Export datasets to Train](/eval/export-datasets)
* [Deploy an inference model](/eval/run-an-inference-model)