The Usage tab is available on any deployed model. If you don’t have one yet, see Deploy an inference model.
Steps
1. Open the Usage tab
Open a deployed model’s card and select the Usage tab. Use the Last 7 Days dropdown to change the time window, Refresh to pull the latest data, or Live to stream new requests as they arrive.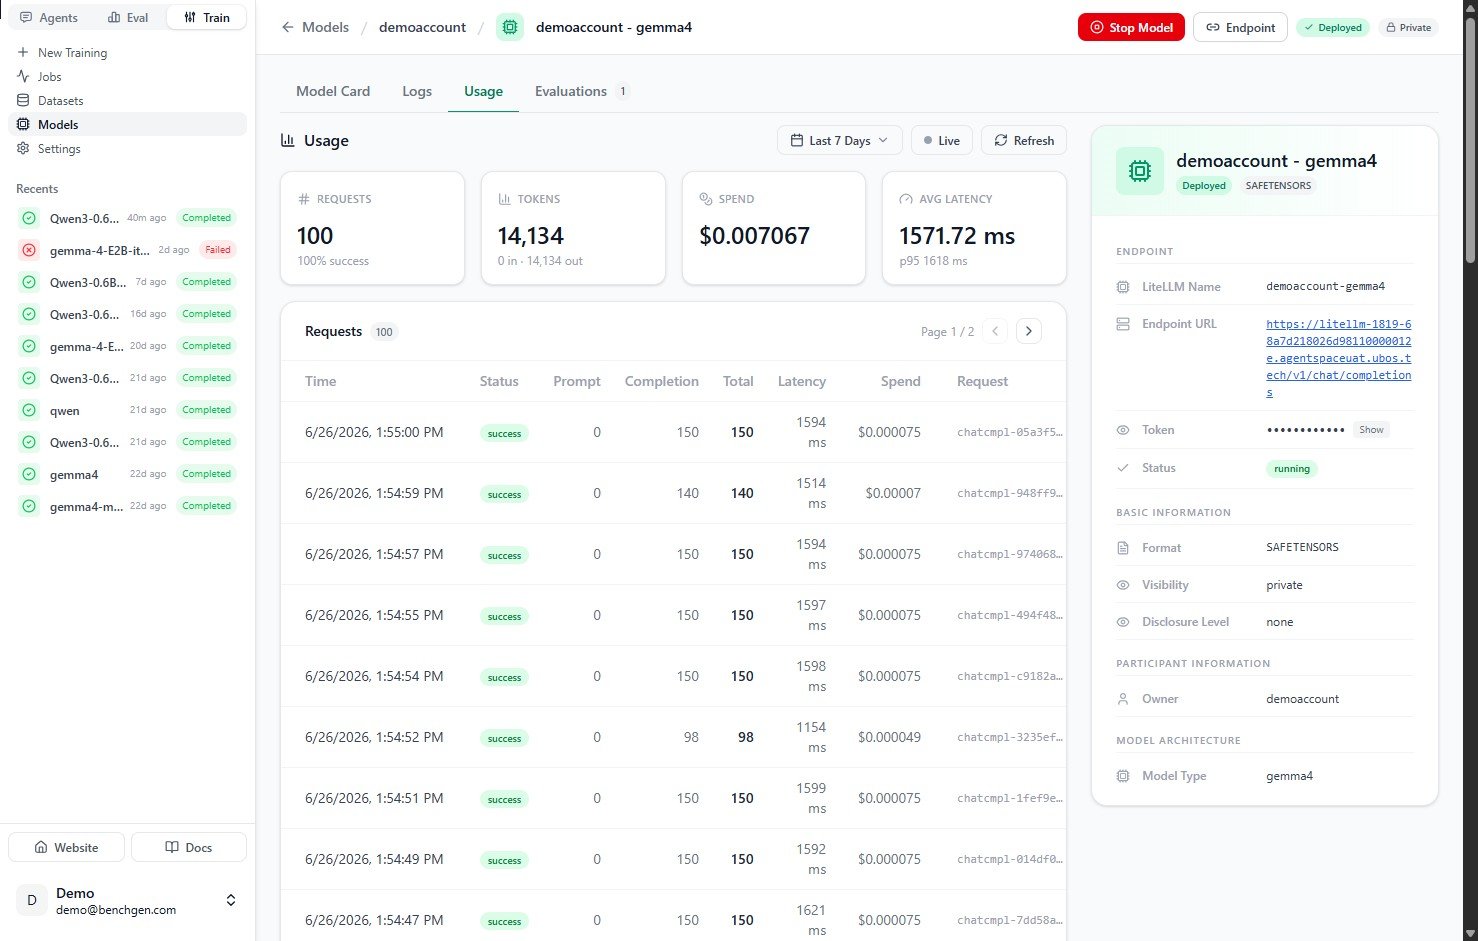
2. Read the summary metrics
Four cards summarize activity for the selected window:| Card | What it shows |
|---|---|
| Requests | Total requests, with the success rate below. |
| Tokens | Total tokens, split into input (prompt) and output (completion). |
| Spend | Total cost across all requests. |
| Avg Latency | Mean response time, with the p95 latency below it. |
3. Browse the request log
The Requests table lists every call to the endpoint, newest first. It’s paginated, so use the arrows to page through history.| Column | Meaning |
|---|---|
| Time | When the request was made. |
| Status | success or error. |
| Prompt | Input (prompt) tokens. |
| Completion | Output (completion) tokens. |
| Total | Total tokens for the request. |
| Latency | Response time in milliseconds. |
| Spend | Cost of the request. |
| Request | The request ID (for example chatcmpl-…). |
4. Inspect a single request
Click any row to open its detail drawer. This is where you debug a specific call.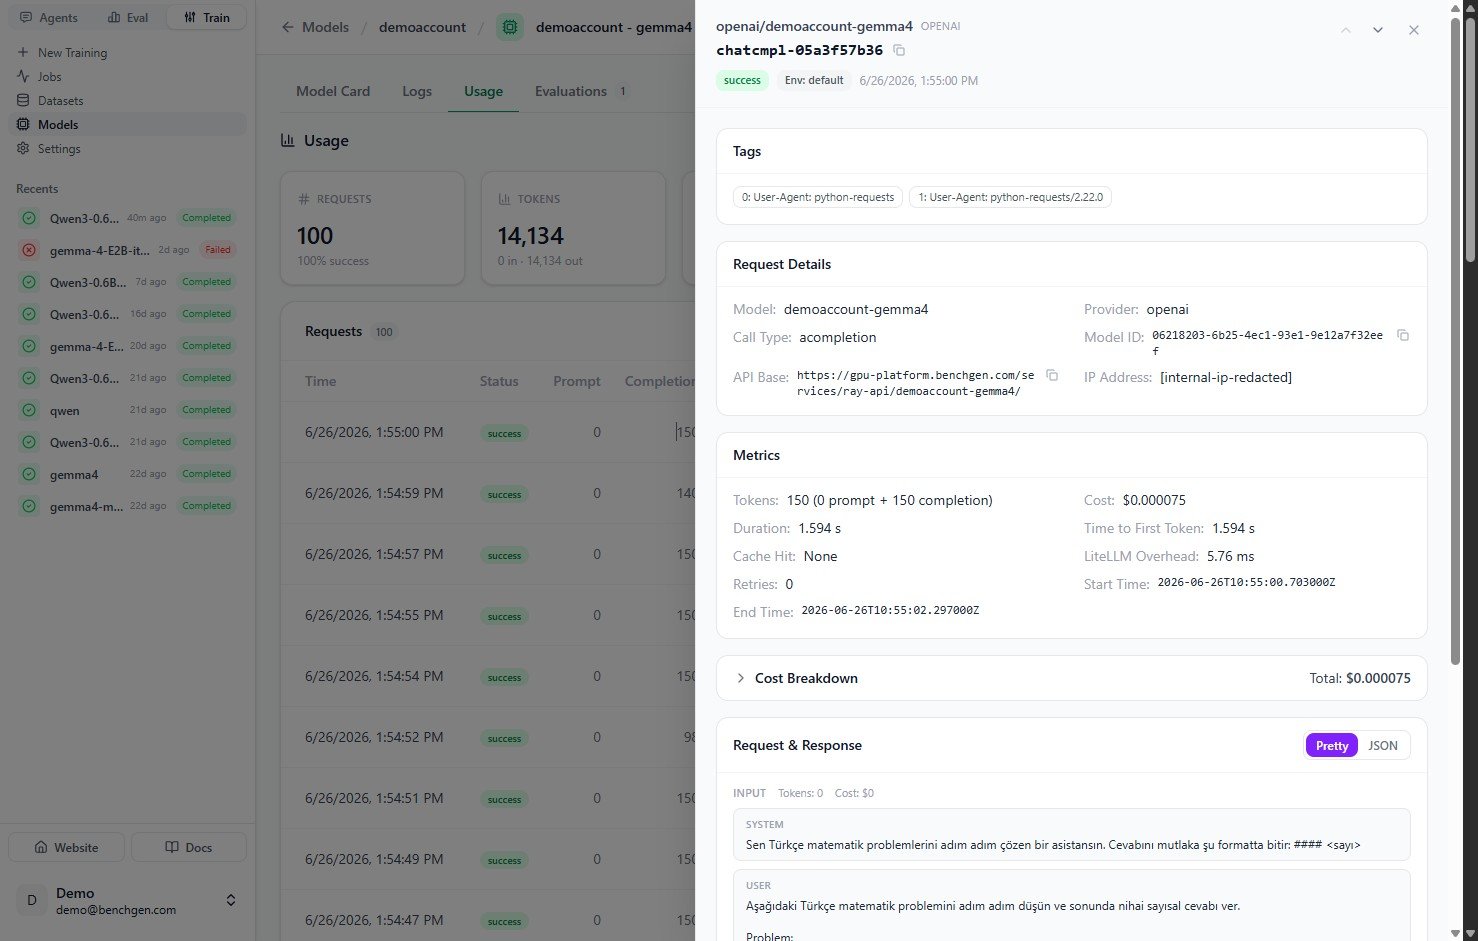
| Section | What’s inside |
|---|---|
| Request Details | Model, provider, call type, model ID, API base, and (redacted) IP address. |
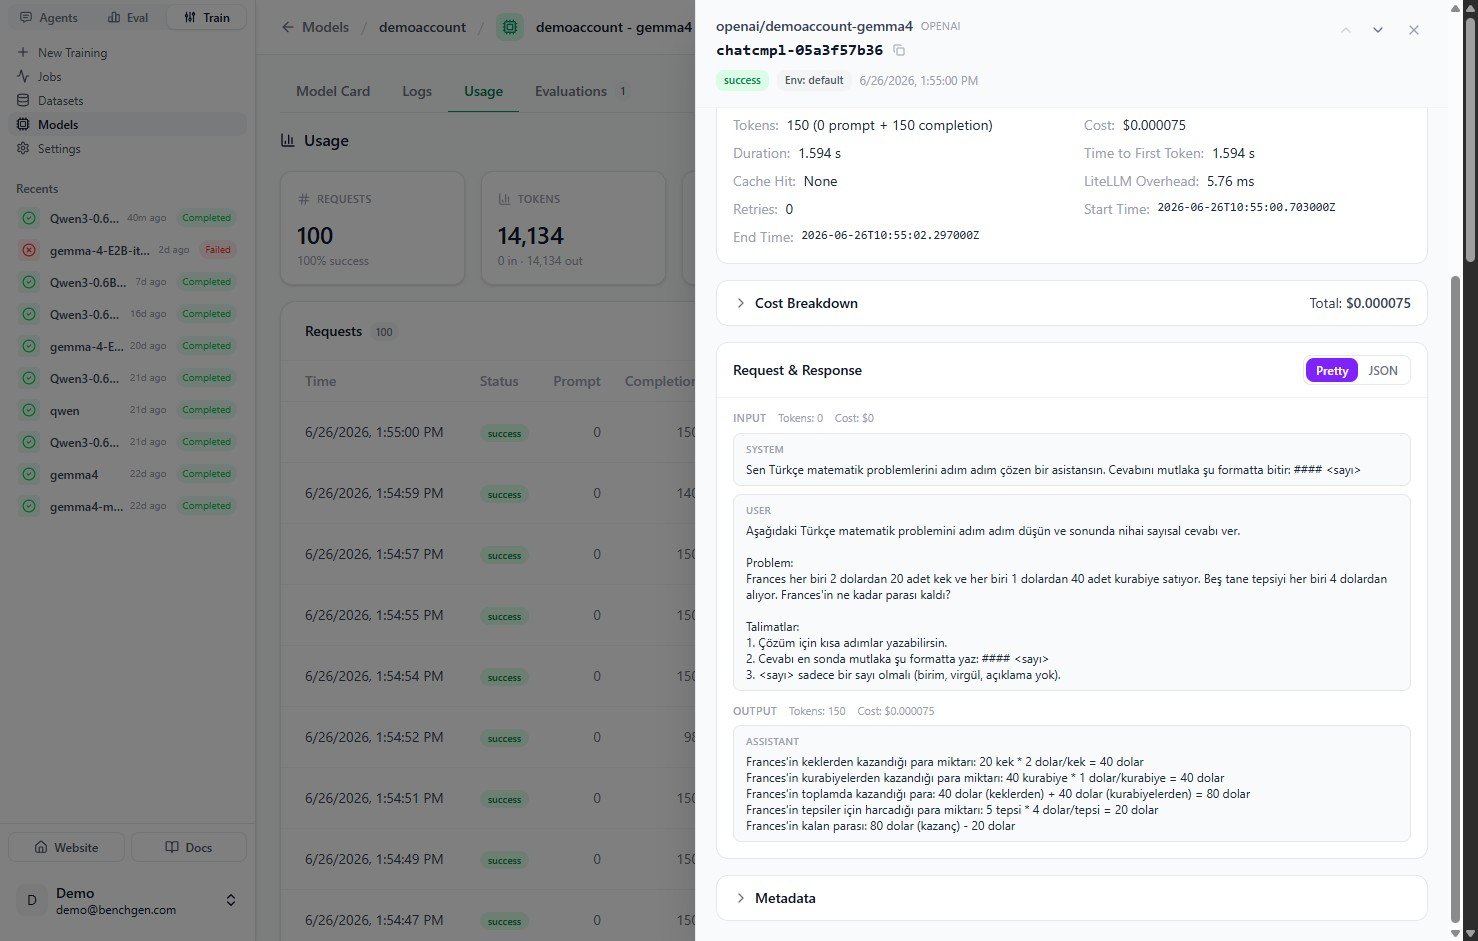
| Metrics | Token split, cost, duration, time to first token, cache hit, LiteLLM overhead, retries, and start/end times. |
| Cost Breakdown | The cost components that add up to the request total. |
| Request & Response | The full exchange, with a Pretty / JSON toggle. Shows the system and user input and the assistant output. |
| Metadata | Additional metadata captured for the request. |
5. Watch live traffic
Toggle Live to auto-refresh the tab every 15 seconds. A banner confirms live mode is on; click Stop to pause it. This is useful while load-testing or watching a benchmark run drive requests.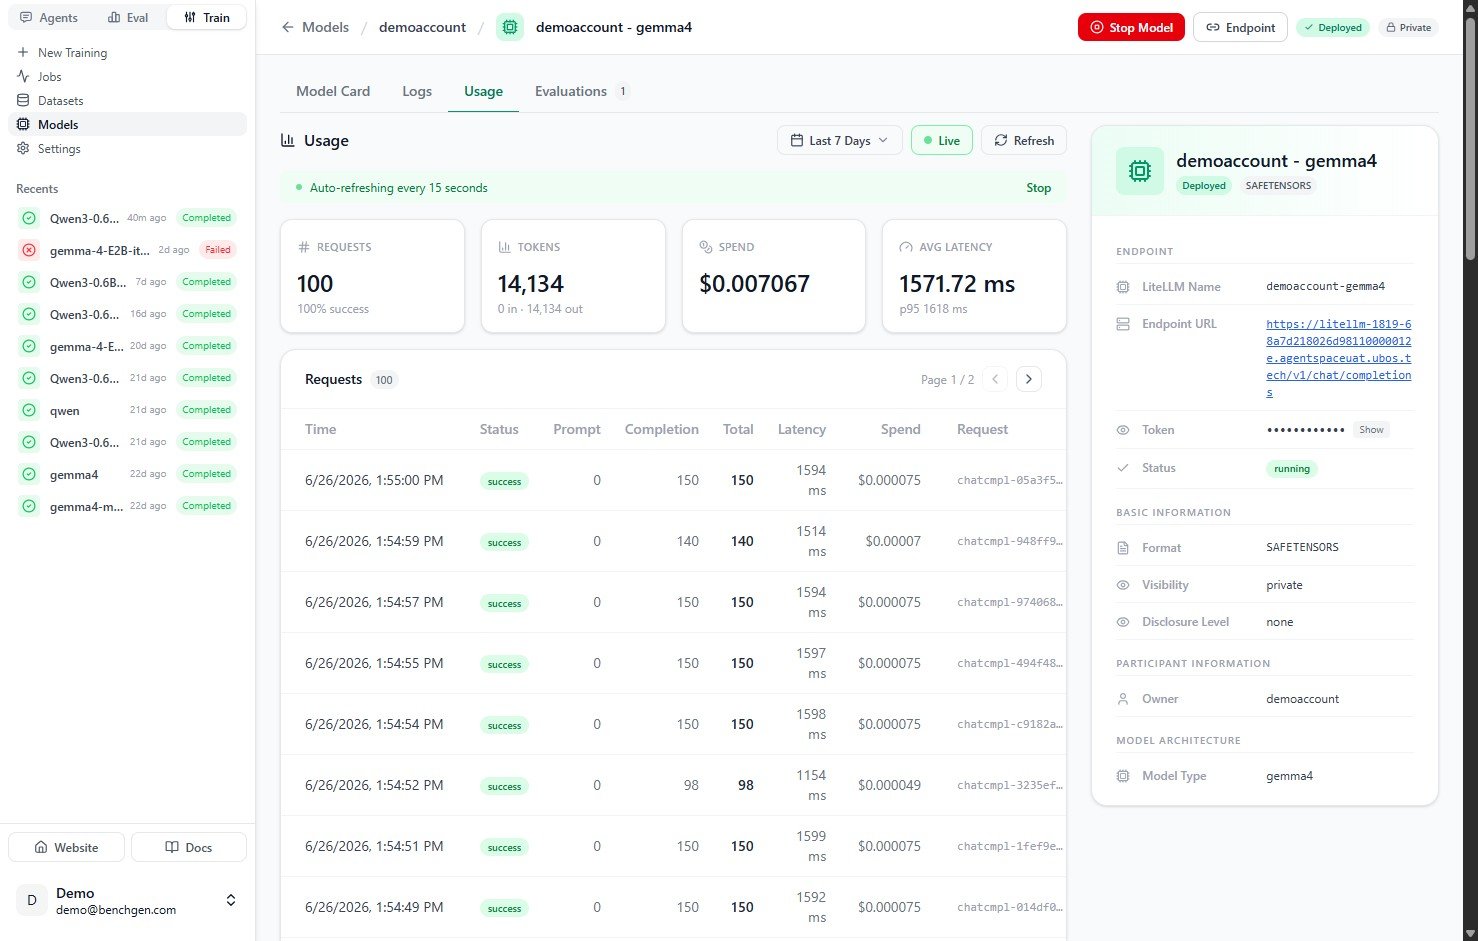
Next Steps
Usage data comes from real traffic. Deploy a model to start serving requests, or run an evaluation against it to generate activity you can watch here in real time.
Deploy an inference model
Spin up a live, OpenAI-compatible endpoint that records usage.
Evaluate an inference model
Benchmark a running model and watch the requests stream in.