

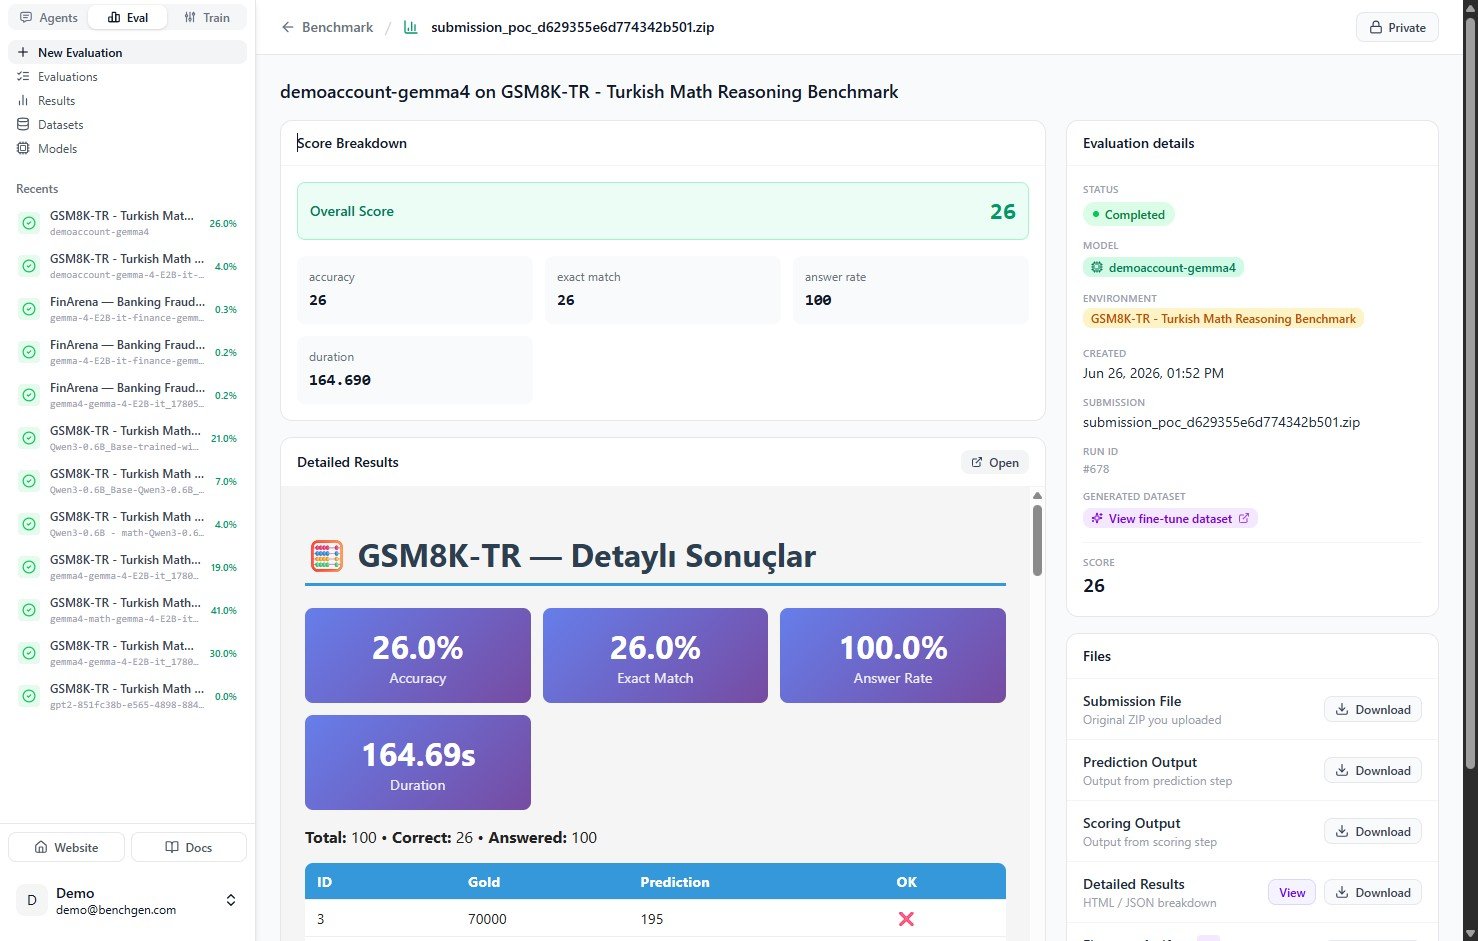
A completed evaluation on GSM8K-TR: score breakdown, the environment's own detailed report, and the evaluation details and files sidebar
Score Breakdown
The Overall Score tile is followed by the individual metrics the environment’s scoring program reported. These are entirely environment-defined, not a fixed set, so two runs can show completely different tiles:- A math benchmark might report accuracy, exact match, answer rate, and duration.
- A routing benchmark might instead report accuracy, correct, total, total cost usd, and avg cost usd per task.
Detailed Results
This embeds the HTML report the environment’s own scoring program generated, the same harness and scoring rules described in the Overview. Layout is entirely up to whoever built the environment:- The example above is a simple report: a few stat tiles plus a per-question table with the case ID, the Gold (expected) answer, the model’s Prediction, and a pass/fail mark.
- Others go further, for example breaking results down by difficulty, by domain, or by routing target with their own bar charts, on top of the same accuracy-style tiles.
Evaluation details
The sidebar summarizes the run:
If you own the run, a Run configuration button below the sidebar opens the sampling parameters and environment variables it used, see Environment Variables.
Files
Every artifact the run produced is downloadable from Files, each row has its own Download button so you can grab exactly the one you need: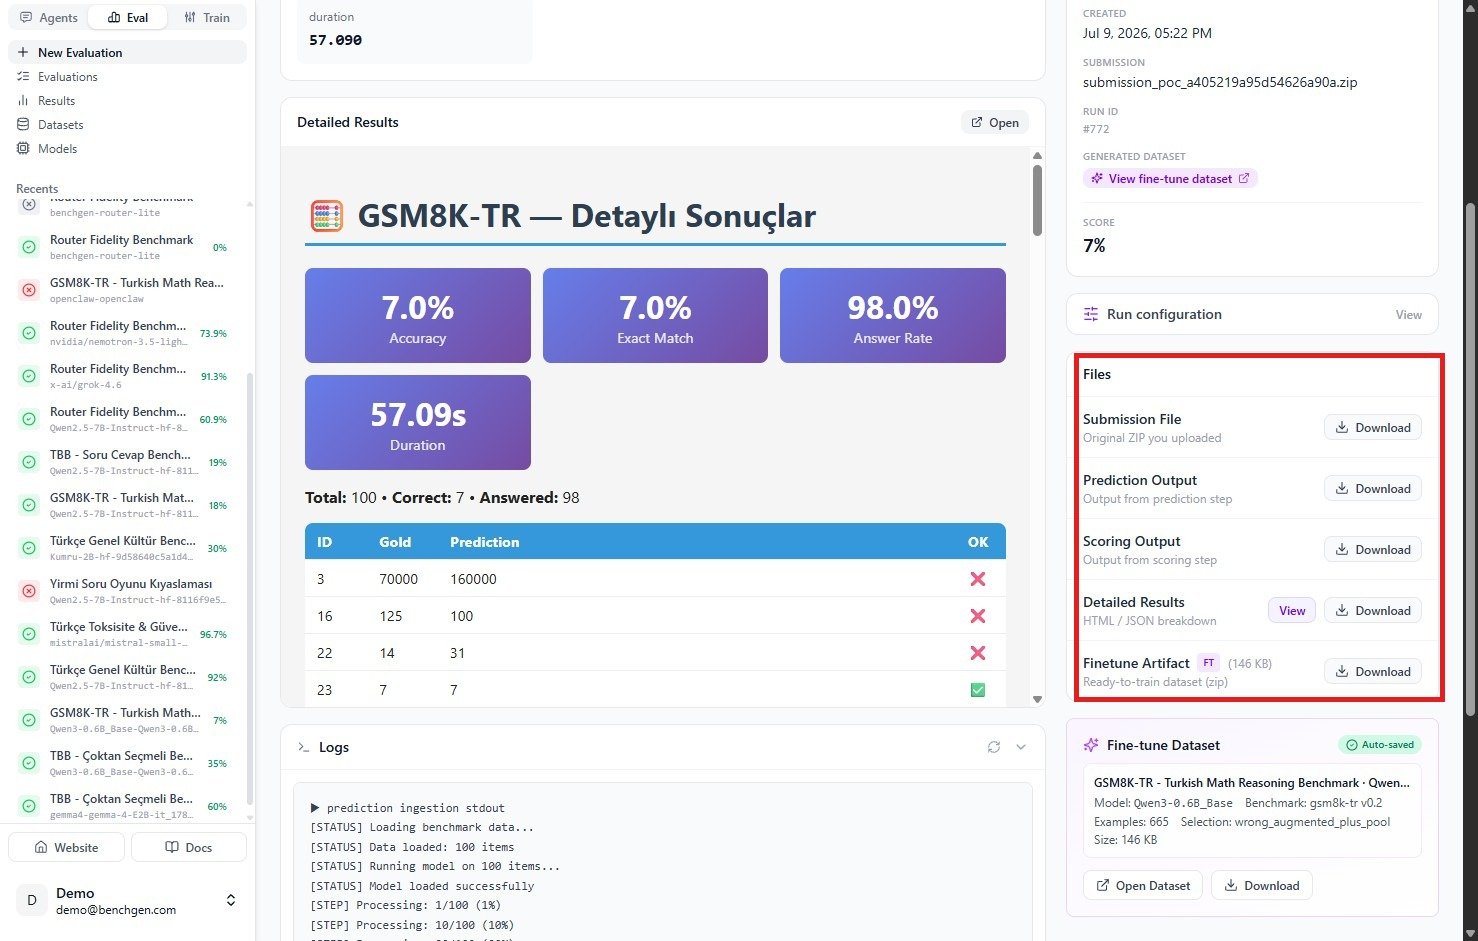
The Files card in the sidebar: Submission File, Prediction Output, Scoring Output, Detailed Results, and Finetune Artifact
Prediction Output example
BenchGen’s Question-Answer template’s ingestion program writes onepredictions.json per run:
Scoring Output example
The Code (SWE-style) template’s scoring program reads thatpredictions.json and writes its own scores.json, with whatever metric keys that benchmark defines:
scores.json keys are exactly what populates the Score Breakdown tiles for that run, matched against the leaderboard columns declared in the environment’s competition.yaml.
Finetune Artifact example
When a scoring program also writes afinetune_artifact.zip, BenchGen extracts it and lists it here. Inside, it’s a small manifest plus the training rows:
Below Files, a Fine-tune Dataset panel either lets you save this artifact as a training dataset, or tells you the scoring program didn’t emit one for this run. Turning results into training data is covered in Export Datasets → Train.