Need a running model first? This guide assumes you already have a live endpoint. If you don’t, follow Deploy an inference model and come back once its status reads running.
Prerequisites
- A model in the running state. See Deploy an inference model.
- A benchmark or environment to evaluate against, either from the Environments Hub or a custom environment you uploaded.
Steps
1. Open a benchmark
Open the environment you want to evaluate against. Its Overview tab describes what the benchmark measures and how submissions are scored, and shows tabs for Phases, Leaderboard, Evaluations, and Evaluate. To start, click Evaluate in the top right corner, or open the Evaluate tab.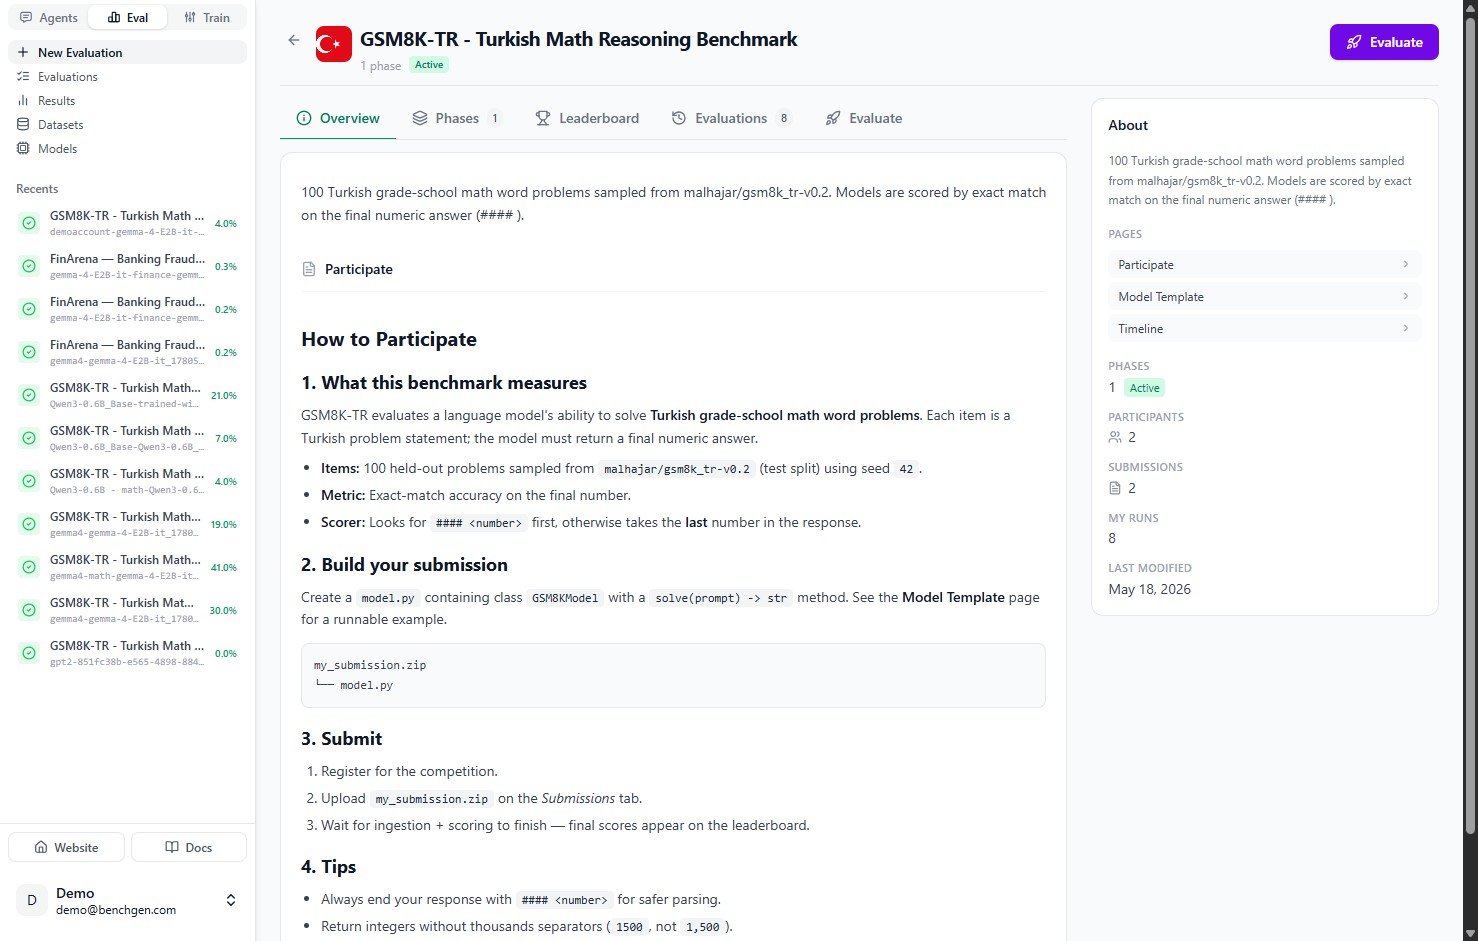
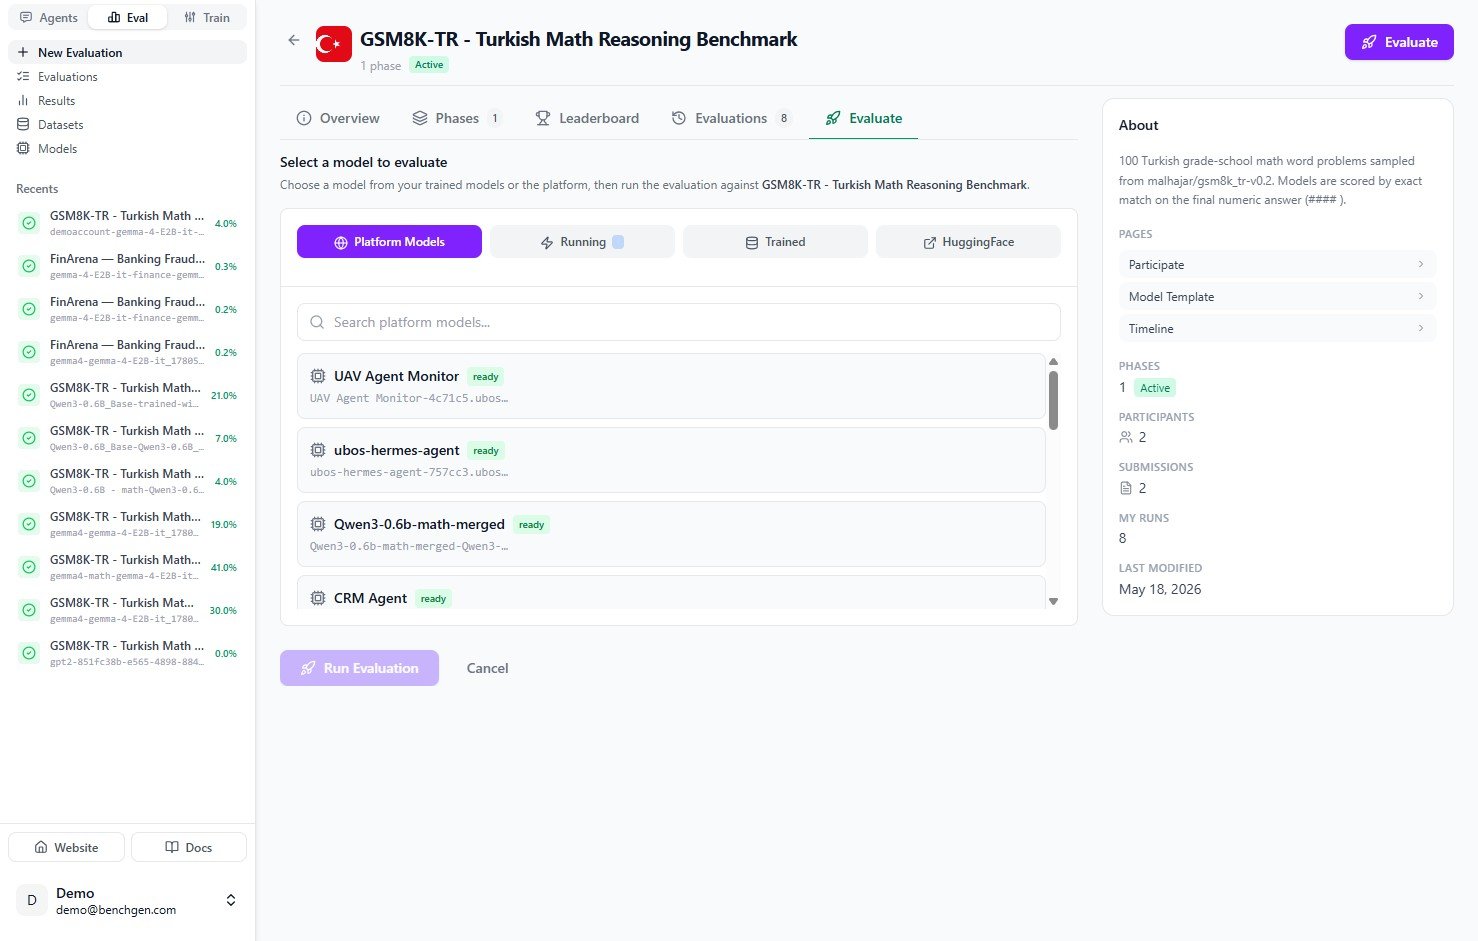
2. Choose a model source
The Evaluate tab opens with “Select a model to evaluate.” Models are grouped by source. Pick the tab that matches where your model lives:| Source | Use when |
|---|---|
| Platform Models | The model is already published or deployed on BenchGen. |
| Running | The model is a live endpoint you started with Run Inference. |
| Trained | The model is a checkpoint you fine-tuned in Train. |
| HuggingFace | You want to pull a public model from the HuggingFace Hub. |
3. Select your running model
Since you just deployed an endpoint, click the Running tab. It lists every model that is currently live. Find the one you deployed. It shows a green running badge.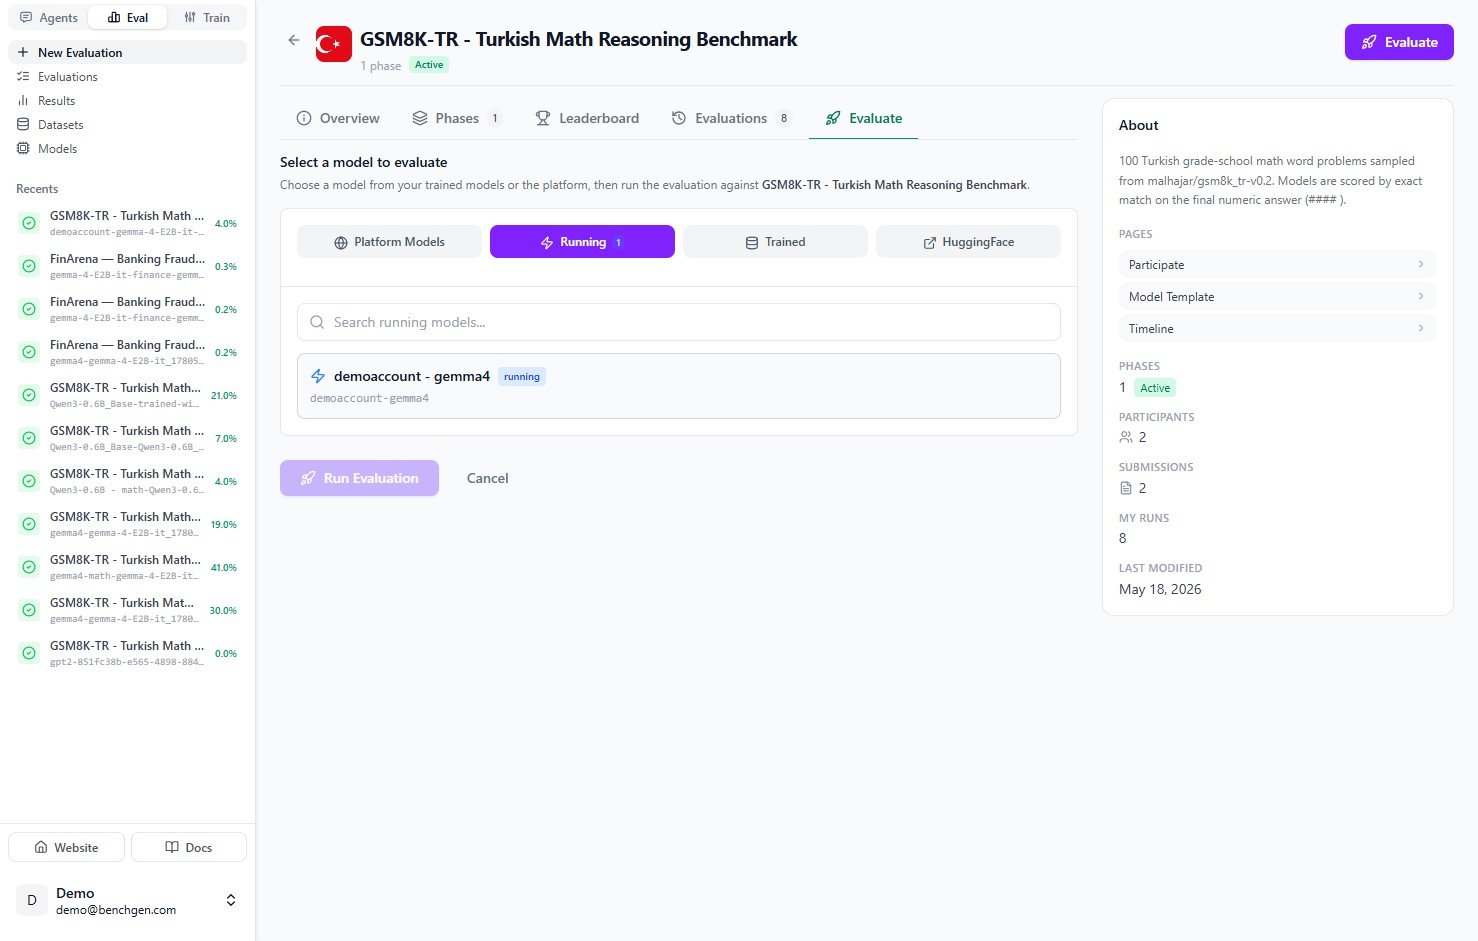
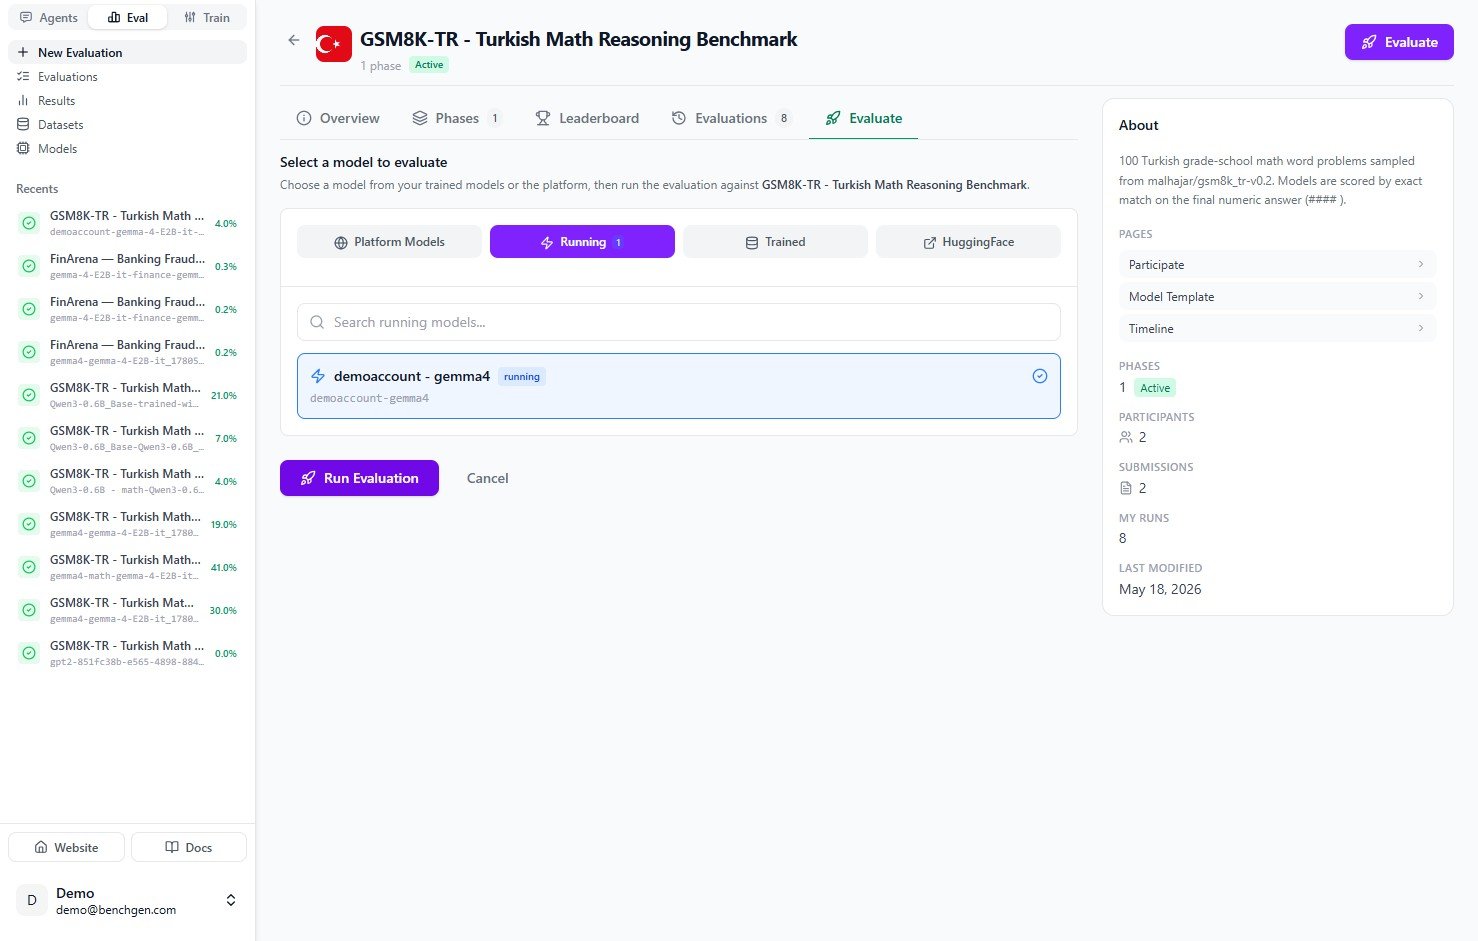
4. Run the evaluation
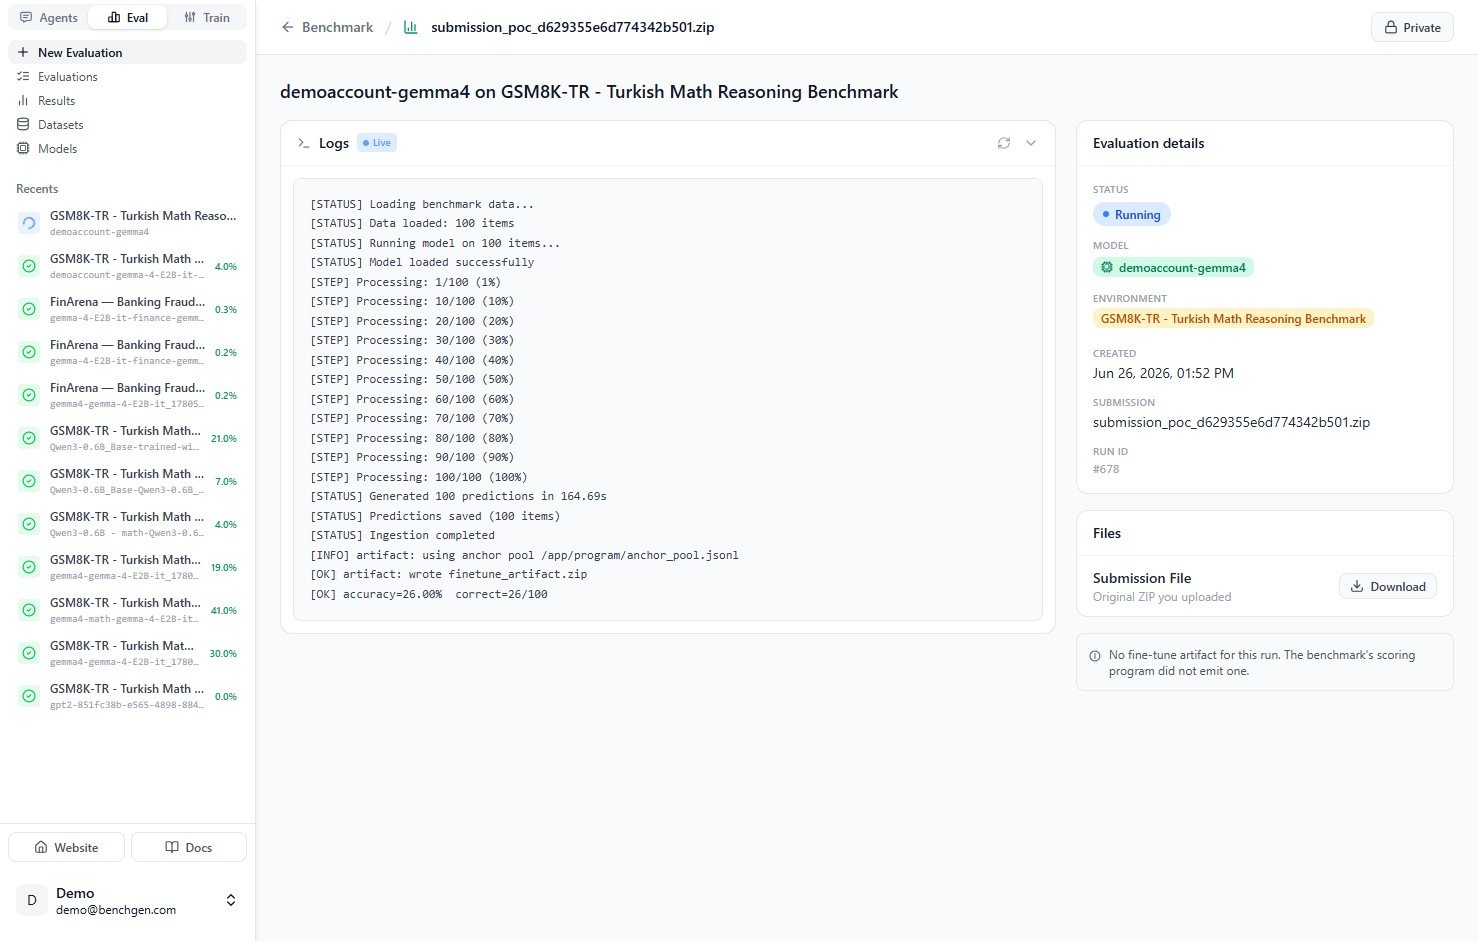
Click Run Evaluation. BenchGen creates an evaluation run, generates a submission for the selected environment, and starts running your model against the test cases.5. Monitor progress
The run opens to a live log view. Status messages stream as the run progresses: it loads the benchmark data, runs the model on each item, and reports progress likeProcessing: 10/100 (10%).
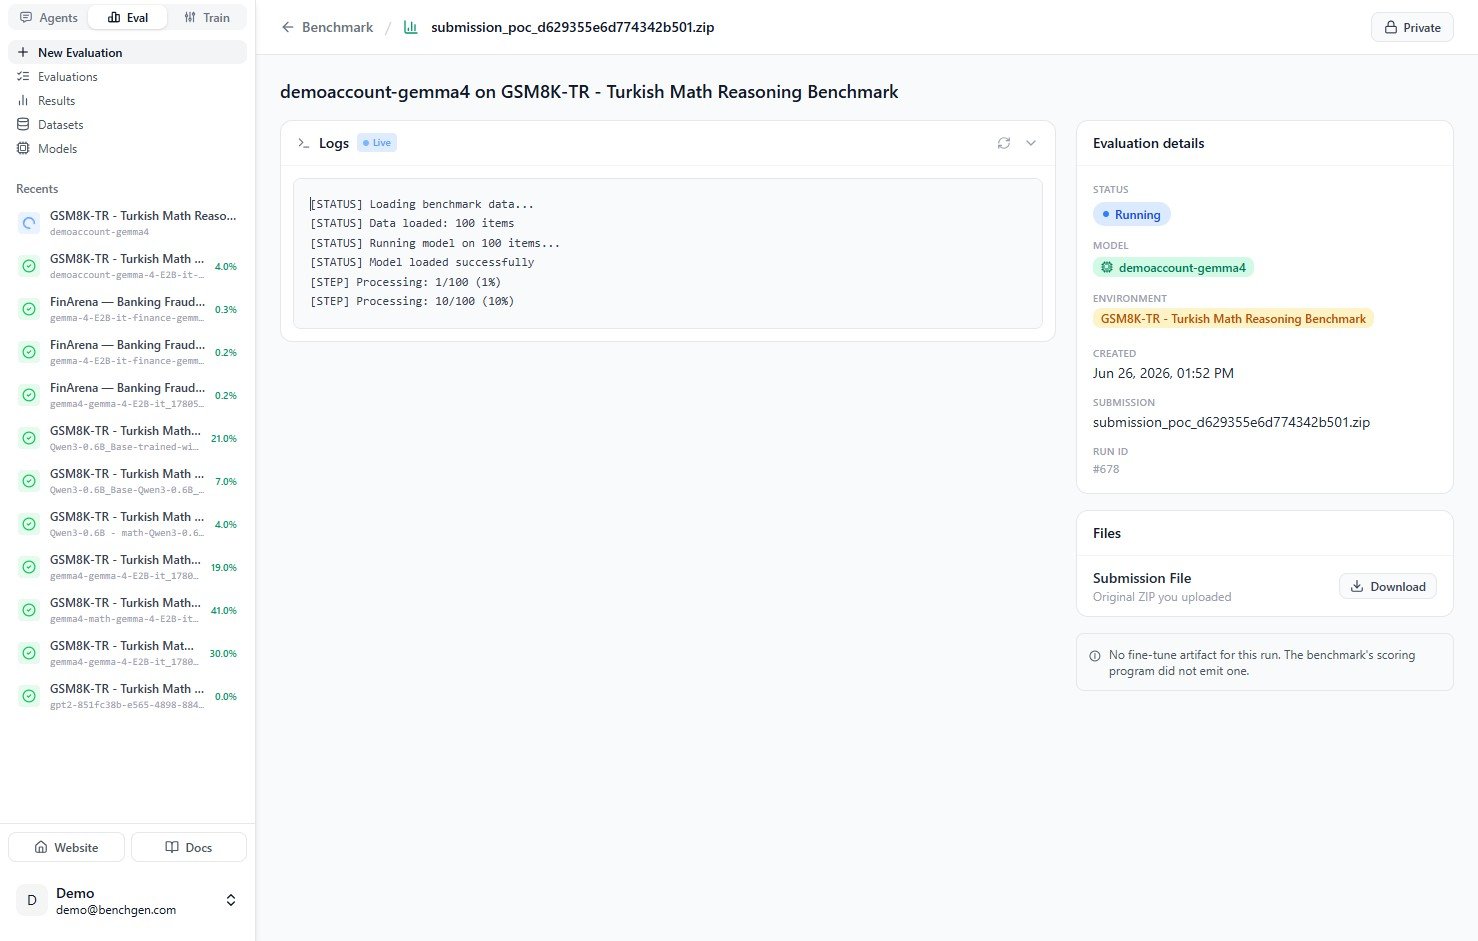
| Field | Meaning |
|---|---|
| Status | Running while in progress, Completed when finished. |
| Model | The model being evaluated. |
| Environment | The benchmark the model is scored against. |
| Created | When the run started. |
| Submission | The generated submission archive for this run. |
| Run ID | Unique identifier for the run, for example #678. |
accuracy=26.00% correct=26/100.
6. Review scores and results
When the run finishes, the status turns to Completed and a Score Breakdown replaces the live logs.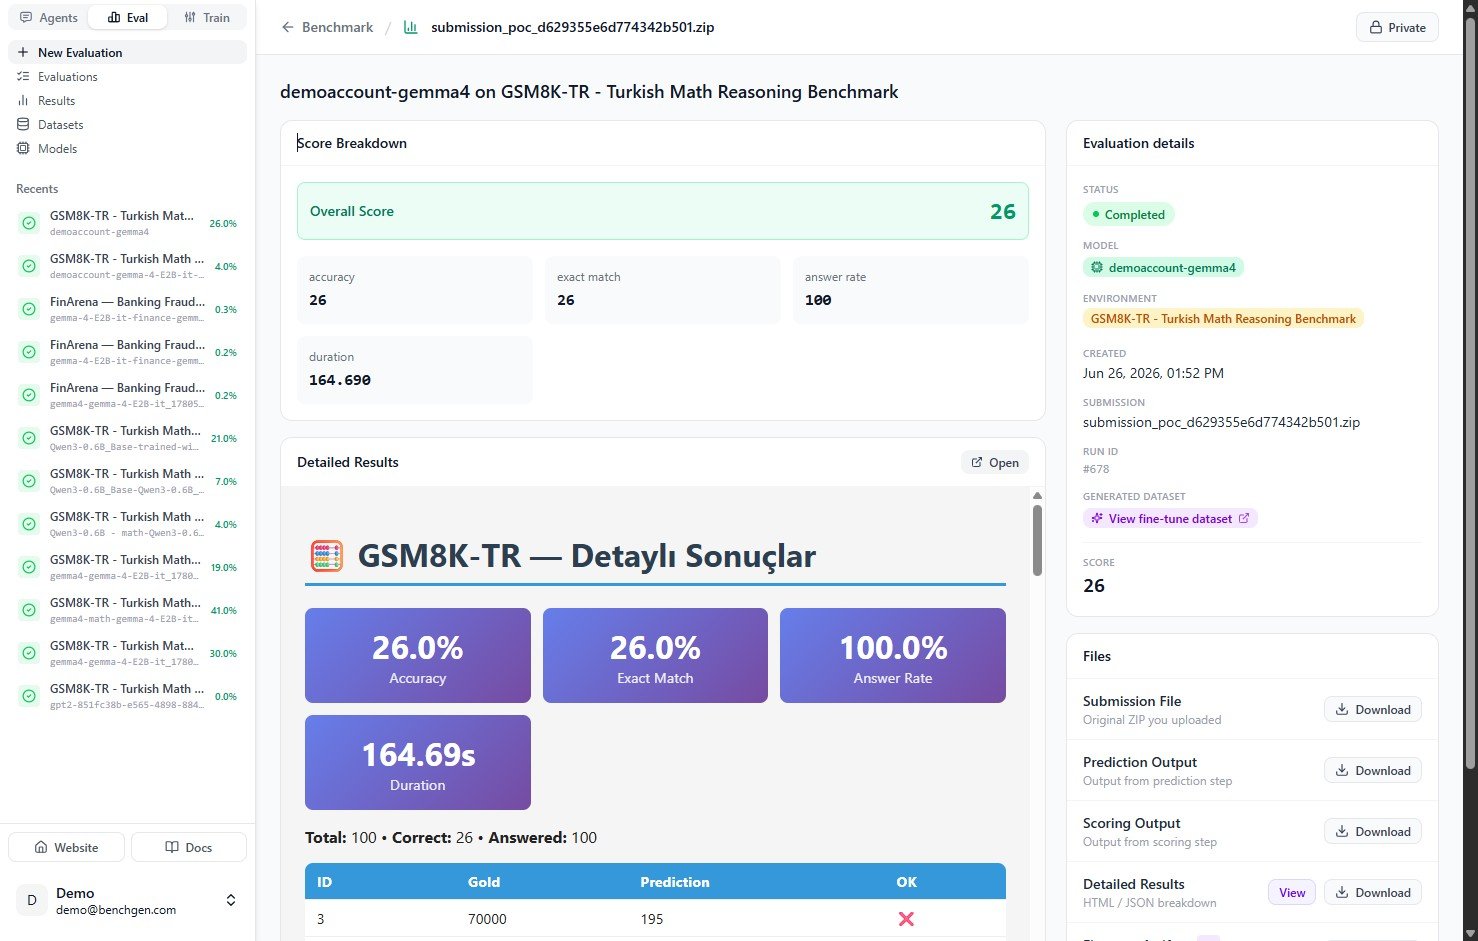
| Metric | Meaning |
|---|---|
| Overall Score | The headline score for the run. |
| accuracy | Percentage of items answered correctly. |
| exact match | Percentage of responses that matched the expected answer exactly. |
| answer rate | Percentage of items the model produced any answer for. |
| duration | Wall-clock time for the full run. |
Download the artifacts
The Files section in the panel on the right lets you download everything the run produced:| File | Contents |
|---|---|
| Submission File | The original archive submitted to the benchmark. |
| Prediction Output | The model’s raw predictions for every item. |
| Scoring Output | The output emitted by the environment’s scoring program. |
| Detailed Results | The full breakdown for every item. View it in the browser or download it as HTML or JSON. |
| Generated dataset | When the environment emits one, a fine-tune dataset you can open with View fine-tune dataset and carry into Train. |