

Connect an OpenClaw Agent
Install the plugin and get the first traces, if you haven’t yet.
Datasets from an OpenClaw Agent
Turn the turns you read here into dataset items.
Benchmarks
Connecting the agent through the relay registers it as a model in BenchGen. From there it is benchmarked like any other model:- Open a benchmark from the Environments Hub (or a custom environment) and click Evaluate.
-
Under Platform Models, pick the agent by its name.
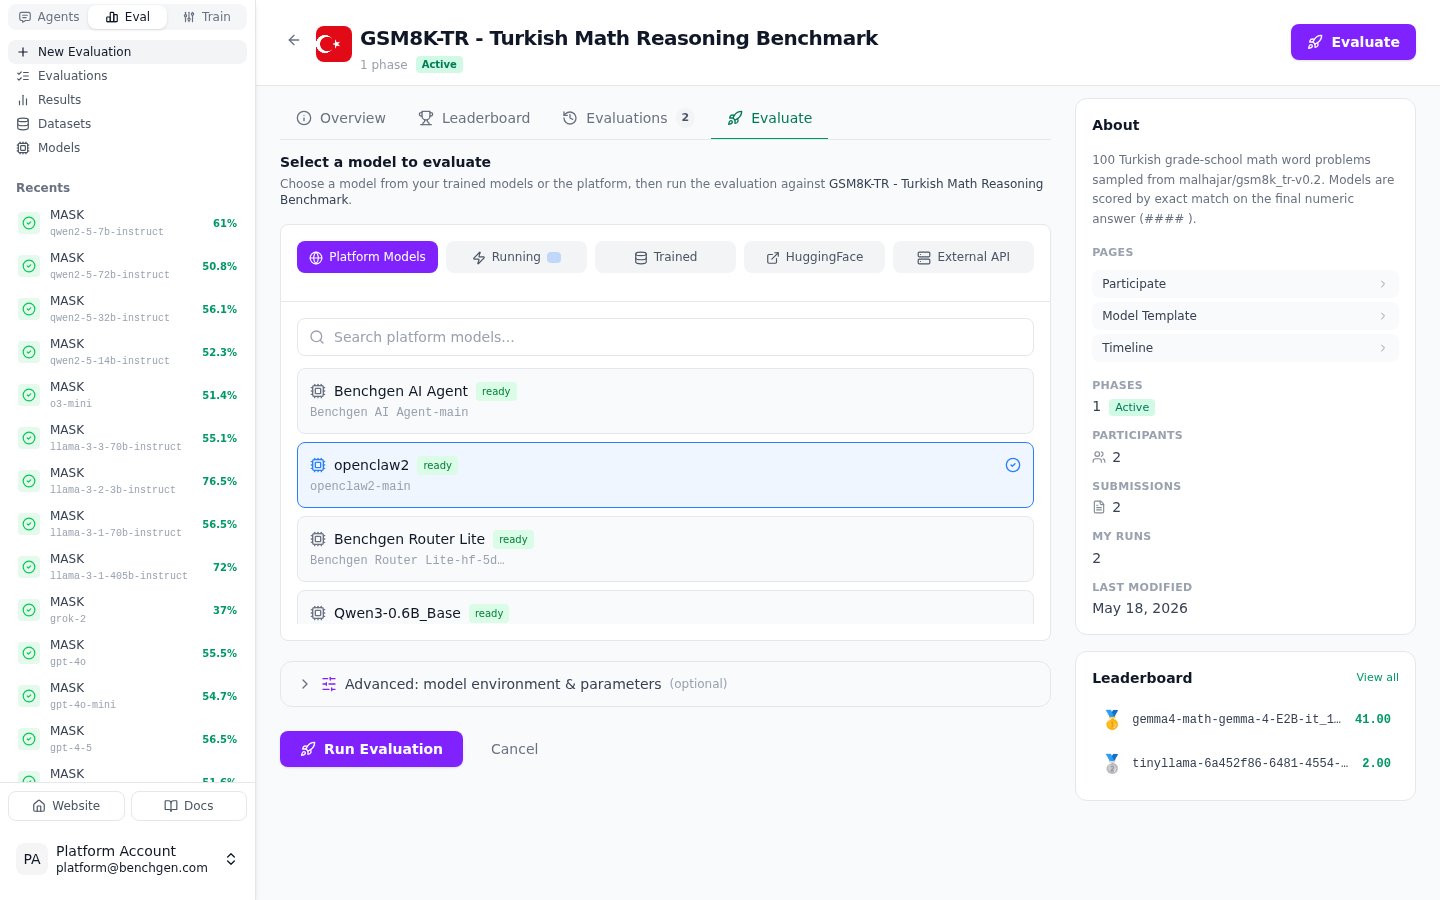
A benchmark's Evaluate tab: the connected OpenClaw agent picked under Platform Models
- Run. BenchGen sends each benchmark prompt to the agent through the same relay that chat uses, so the agent answers with its real system prompt, tools and model, and scores the answers as defined by the environment.
-
Watch the live log. The run opens to a live log view: the benchmark data loads, progress streams item by item (
Processing: 10/100 (10%)), and the scoring output ends with the final score, for exampleaccuracy=90.00% correct=90/100. The Evaluation details panel beside the log sums up the run.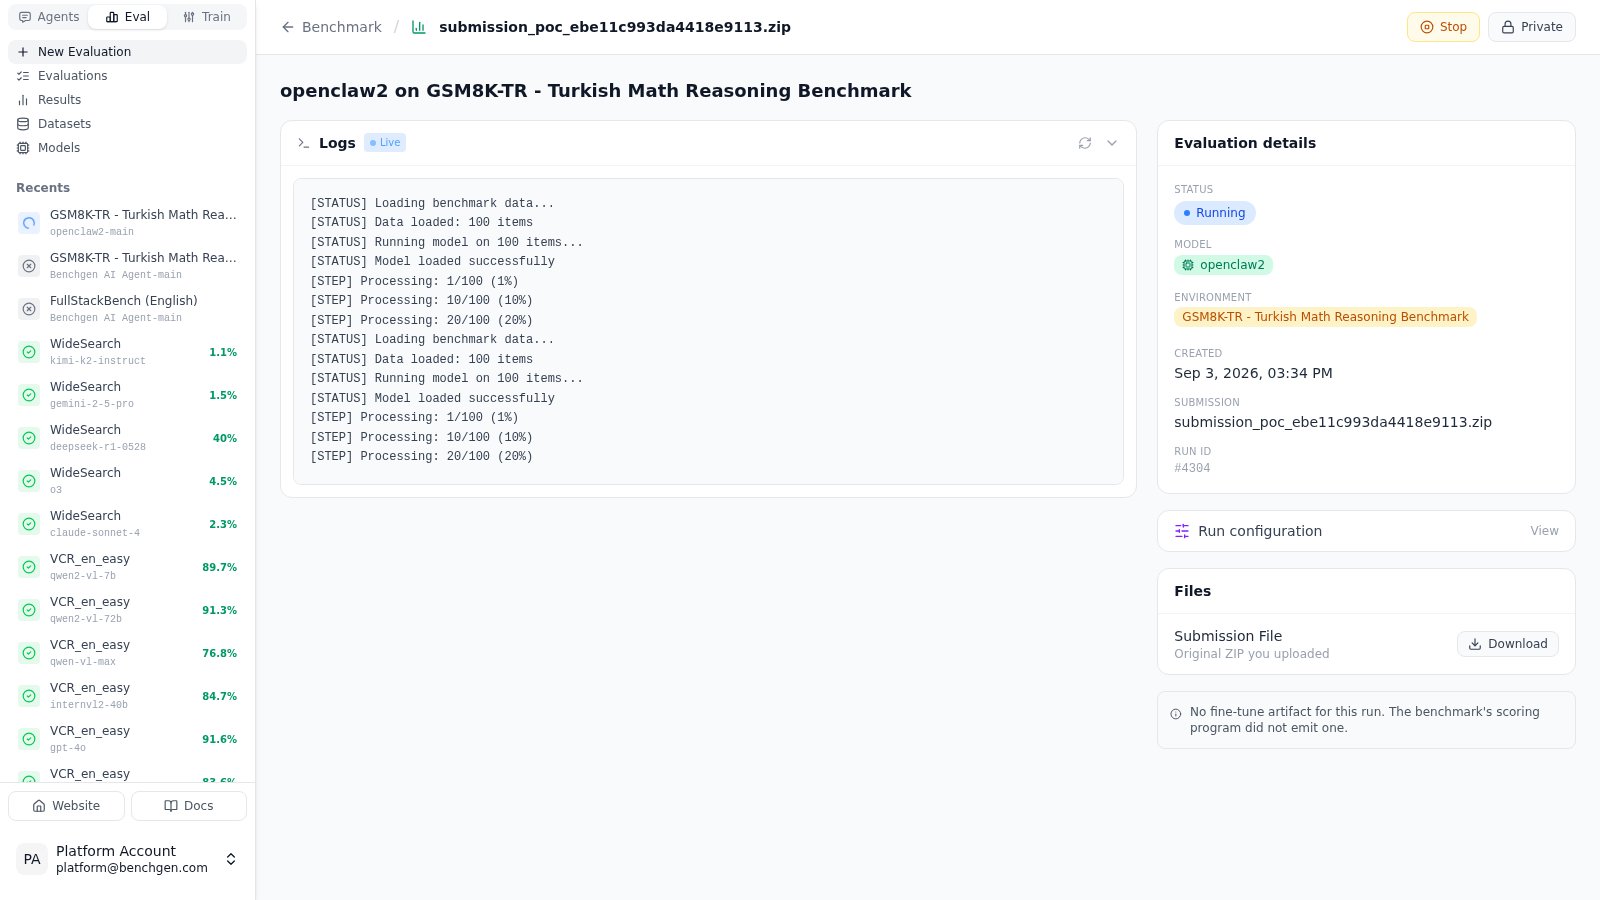
An agent evaluation running: live logs on the left, the Evaluation details panel with the agent as the model on the right
-
Read the run’s traces. Every benchmark turn lands on the agent’s Traces tab as a row of its own: one per task, named
benchgen, taggedbenchgen-chat, all sharing the session key of that run. Filter by the tag (or the run’s session ID) to read, task by task, what the benchmark asked and what the agent answered.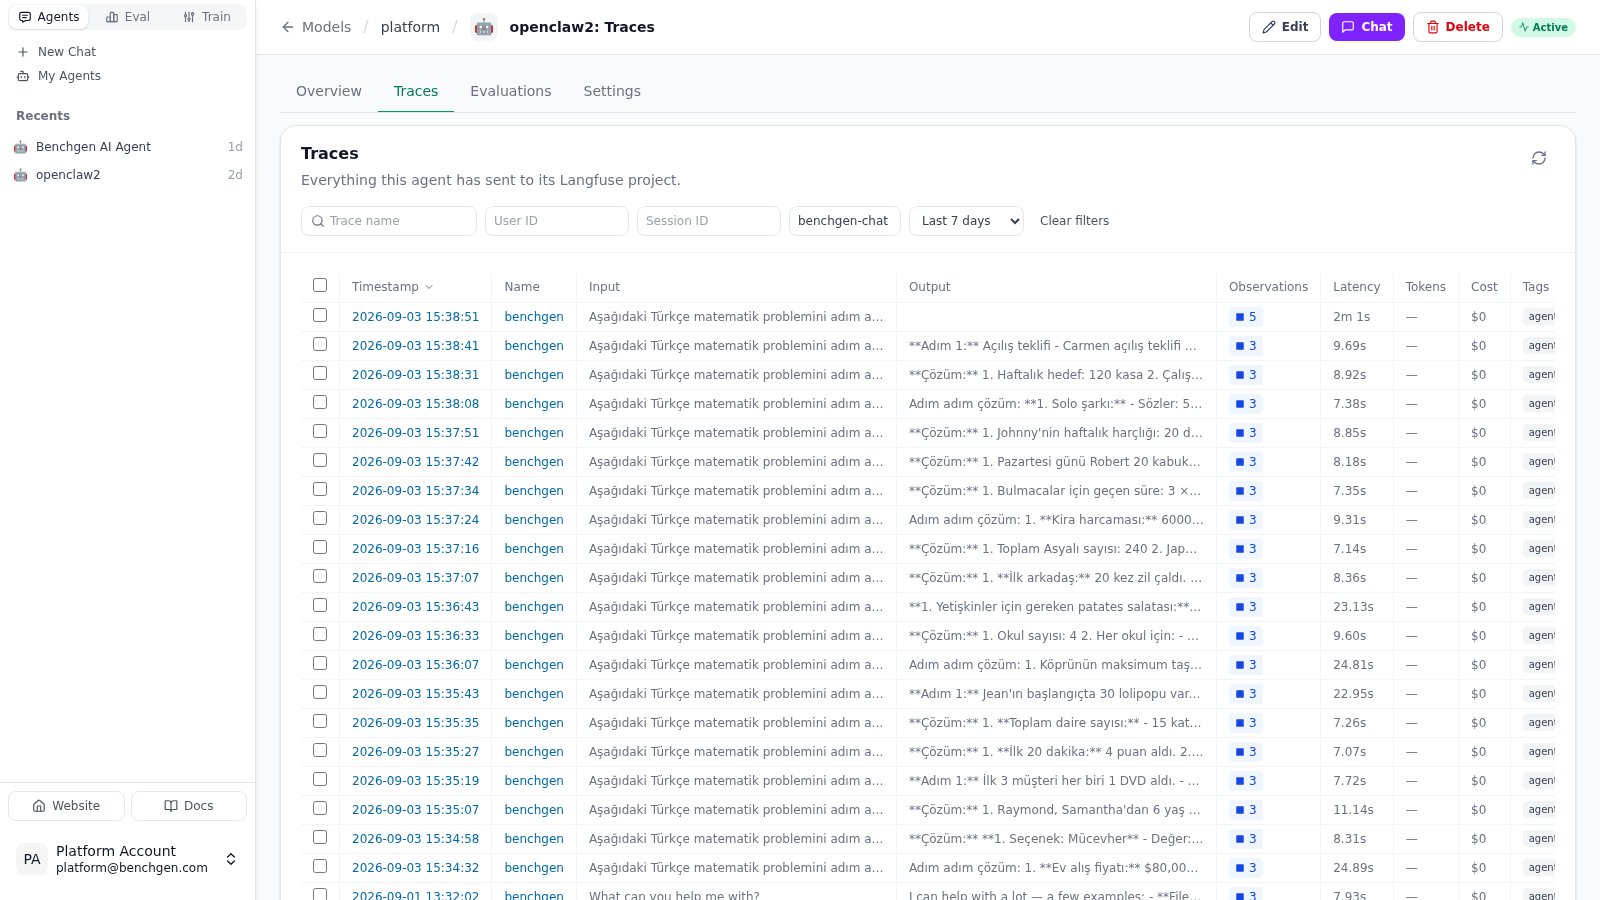
The Traces tab filtered by tag benchgen-chat while a benchmark runs: one row per task, streaming in live
Traces in detail
One trace per message the agent handles; inside it, a span per model call (with output, token usage and cost) and per tool execution (name, input, output, duration, or the error / the reason it was blocked). A trace’s session key is the OpenClaw session the turn ran in, so a conversation reads as one session across turns. The mapping from OpenClaw’s diagnostics events:
On the Traces tab:
- Time range (last 24 h, 7 days, 30 days, all time) and filters by trace name, user ID, session ID and tag. Useful tags:
benchgen-setup(handshakes) andbenchgen-chat(turns that came from BenchGen: chat and benchmarks). - Click a row to open the trace beside the list: its observations, inputs and outputs, latency, tokens and spend.
- Select rows for bulk actions: Add to dataset, Add to annotation queue, Delete traces.
Open a trace
Click a trace’s timestamp to open it next to the list. On the left is the tree of observations (the agent turn,context.assembled, one generation per model
call, one span per tool execution) with a graph of the turn under it; on the
right, the selected observation’s input, output and metadata.
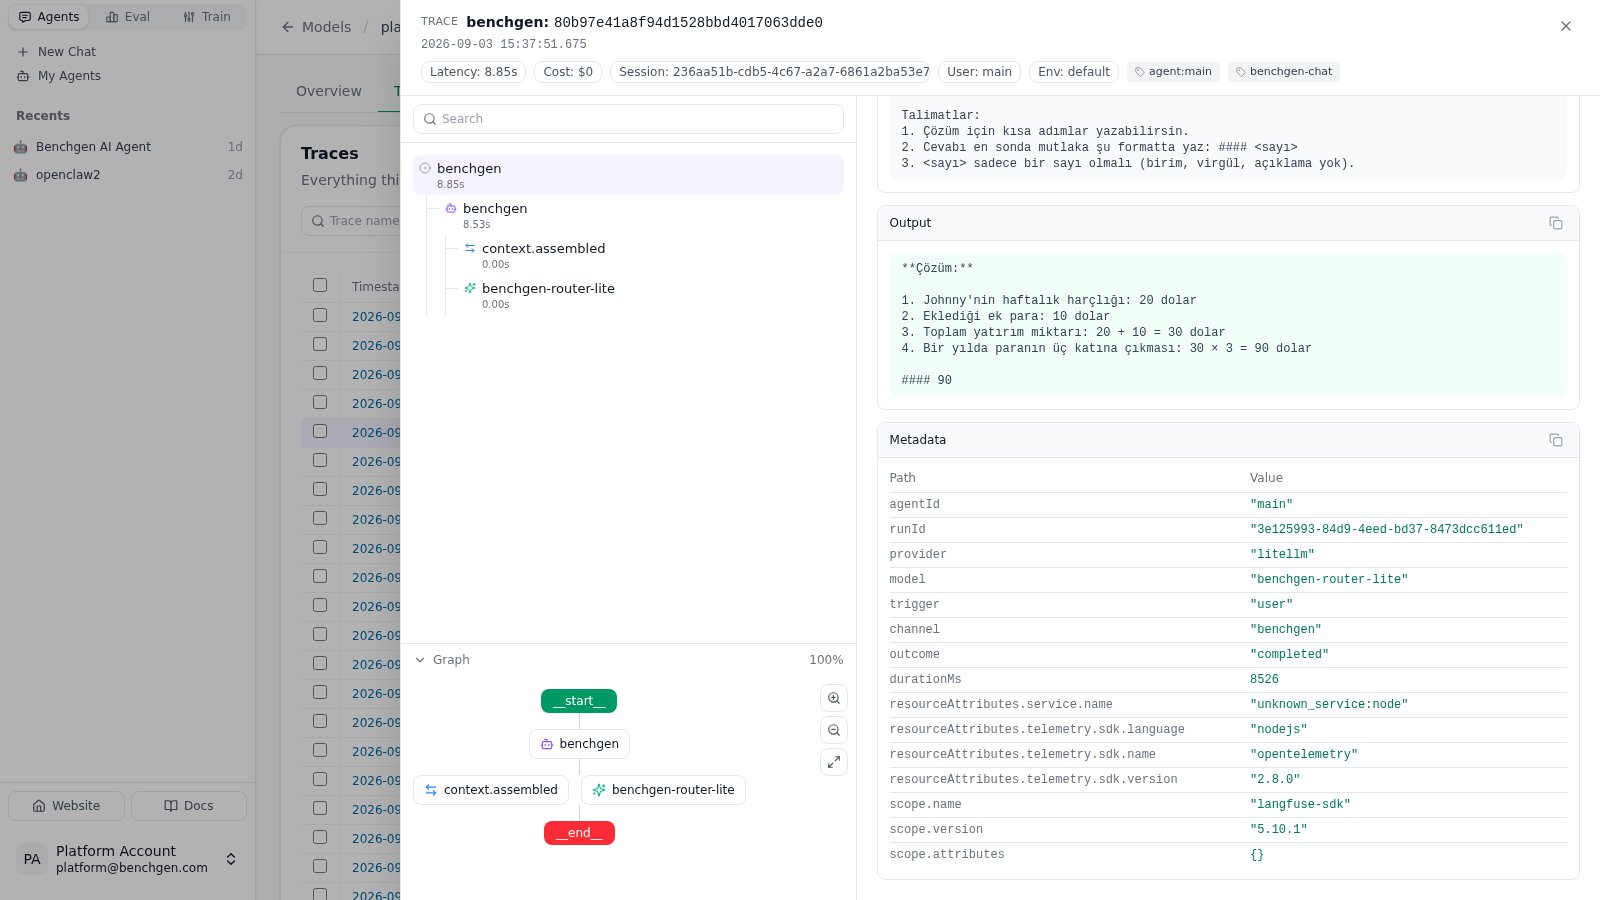
A benchmark turn opened: the observation tree with the turn graph, and the task's output and metadata (outcome, model, run id)
0.5.0 or newer the generation also
carries the token numbers of the call (prompt tokens and context used against
the model’s context window).
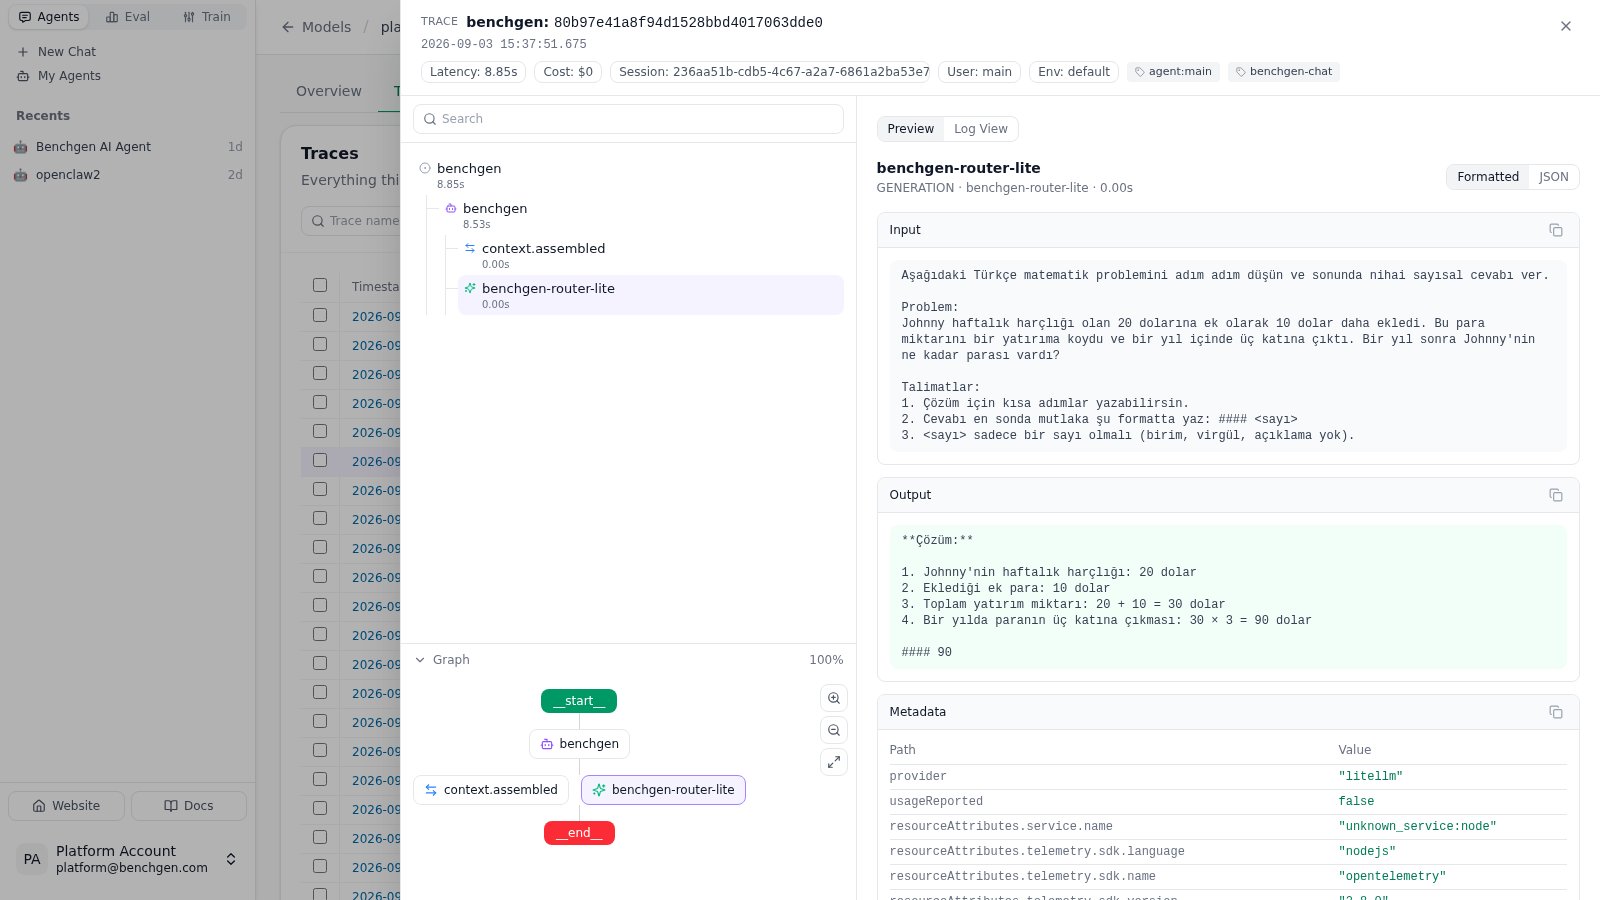
The benchmark turn's generation selected: the exact task the model received and the answer it returned
Next: datasets
The turns you just read are raw material for training and annotation: selecting them on the Traces tab and choosing Add to dataset turns them into dataset items.Datasets from an OpenClaw Agent
Turn real agent traces into training data.